The Work & Movement tab
Who is here during the day, how the roads and the place itself run through the week, how many residents live near transit, how residents work and commute, the jobs located in the area, and the traffic counted on the roads around it.
What this is for
The Work & Movement tab answers "Who is here during the day, where do people work, and how do they get around?". Residents are only part of a market. A store beside an office district serves the people who work there, a cafe on a commuter road serves the people who drive past, and a shop near a station serves the people who get off. This tab puts those flows beside the residents, so that a business that lives on the daytime crowd can see it.
Three different kinds of figure live here, and the tab's note says so. Daytime population is an estimate built from where people work plus shoppers and visitors. Employment is about the people who live here and the work they do, wherever it is. Jobs are the workplaces inside the area, whoever holds them. Keeping the three apart is the key to reading the tab.
Where to find it
Choose Work & Movement in the row of tabs. The day and night figures, employment and occupations are included in every plan. Through the week, transit access, jobs by industry and traffic counts are part of the Pro and Team plans, and each says so where it would appear. The row of links under the question jumps to each section.
Day and night
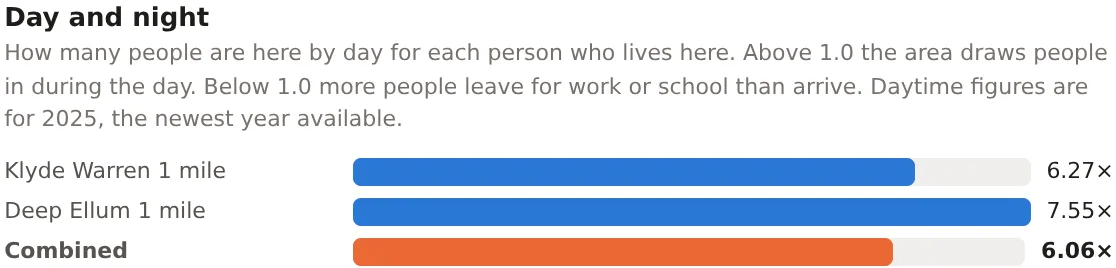
For each location and the combined footprint, how many people are here by day for each person who lives here, as a bar. Above 1.0 the area draws people in during the day, and below 1.0 more people leave for work or school than arrive. The daytime figure is for the newest year available and is an estimate, built from the jobs located in the area, the workers who live in it, and the shoppers, diners, patients and students that jobs miss, checked against a modeled daytime surface. What MarketGround measures says more, and the methodology page gives the detail.
Through the week
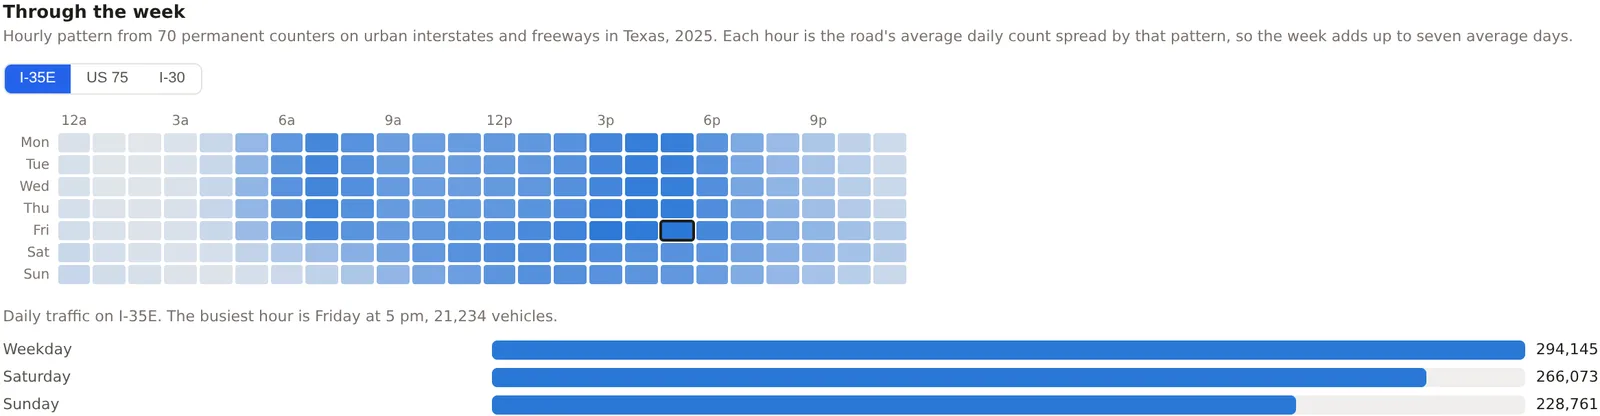
The traffic on each counted road bordering the area, hour by hour across the week, as a grid of seven rows and twenty-four columns with the busiest hours darkest. A row of buttons picks the road. Beneath the grid are the road's weekday, Saturday and Sunday totals and its busiest hour. The pattern comes from the state's permanent counters on roads of the same kind, and each hour is the road's average daily count spread by that pattern, so the week always adds up to seven average days. The basis sentence under the title names the counters the pattern came from.
When the place is busy
An estimate of when the area itself is busier or quieter through the week, on the same grid of days and hours, built from its residents, its jobs, its open retail and food places and its transit stops, spread over the hours by national surveys of how people spend their day. Beneath the grid are the busiest and quietest daytime hours, the shares of the week's activity from residents, workers and visitors, and a bar for each day's share of the week. It shows the rhythm of a place, not a head count, and the card says so. Part of the Pro and Team plans.
Transit access
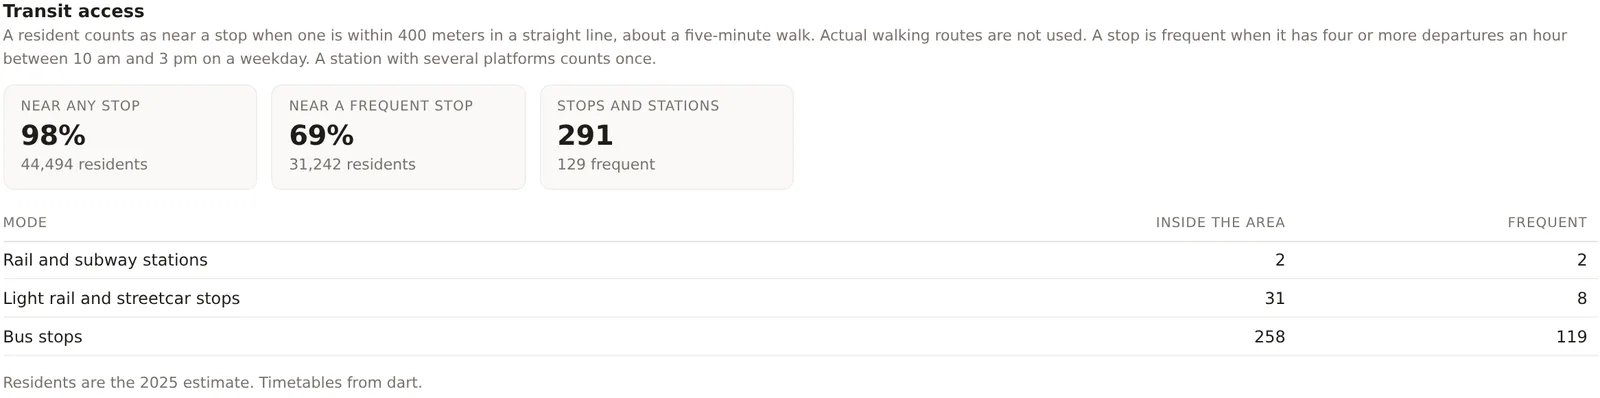
Three figures and a table. Near any stop, the share of residents living within 400 meters, about a five minute walk in a straight line, of any transit stop. Near a frequent stop, the share within the same distance of a stop with four or more departures an hour between 10 am and 3 pm on a weekday. Stops and stations, the number inside the area, with how many are frequent. The table splits the stops by mode, rail and subway stations, light rail and streetcar stops, and bus stops, with how many are inside the area and how many frequent. The residents are the Census-based night population on a fine grid, so the shares carry no range. An area with no timetable loaded within five kilometers says No timetable loaded for this area rather than zero. The methodology page explains how a stop and a frequent stop are counted.
Employment
The people who live here as workers. Workers 16 and over, In labor force, Employed and Unemployed, the last two as shares of the labor force. Work from home and Commute by public transit, as shares of workers. Median commute, one way, in minutes, for those who travel. Management and professional, as a share of employed residents. Beneath the strip, a table gives each location's figures and the combined footprint's. The counts come from the survey's employment and commuting tables and carry ranges. Everything here is about residents wherever they work, which is the opposite of the Jobs section below.
Occupations of residents
One proportion bar of employed residents in the Census Bureau's five broad occupation groups, namely management, business, science and arts, service, sales and office, natural resources, construction and maintenance, and production, transportation and material moving. It describes the residents' jobs, not the jobs located in the area.
Jobs by industry
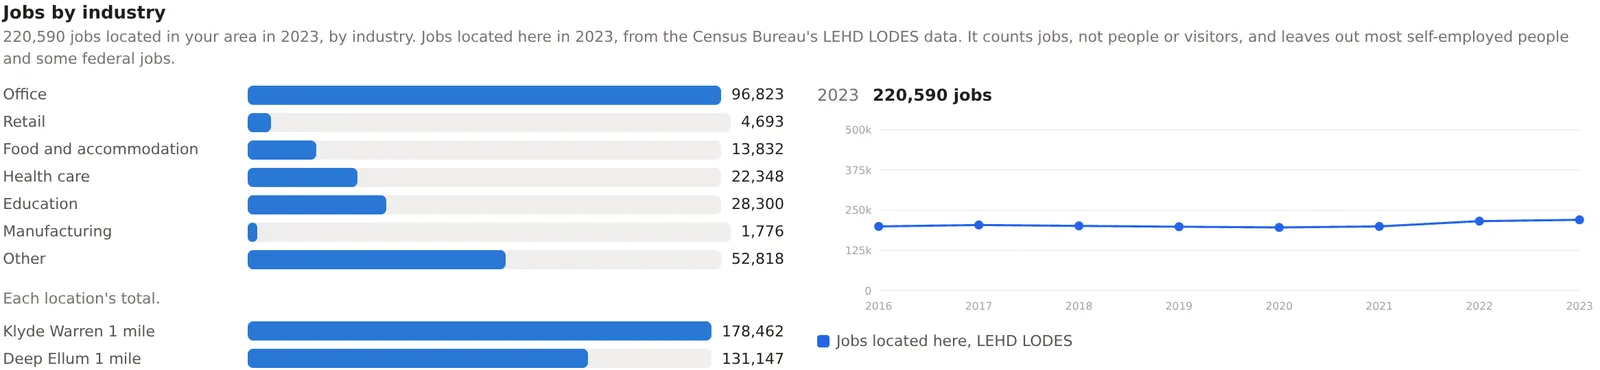
The jobs located inside the area, by industry, from the Census Bureau's LODES data, which counts jobs at the workplace. A bar for each industry group, office, retail, food and accommodation, health care, education, manufacturing and other, with each location's total beneath and a small chart of the total by year beside. It counts jobs, not people or visitors, and leaves out most self-employed people and some federal jobs. The year is shown with the total, and lags the survey year by about two years because that is how the Bureau publishes it. Part of the Pro and Team plans.
Traffic counts
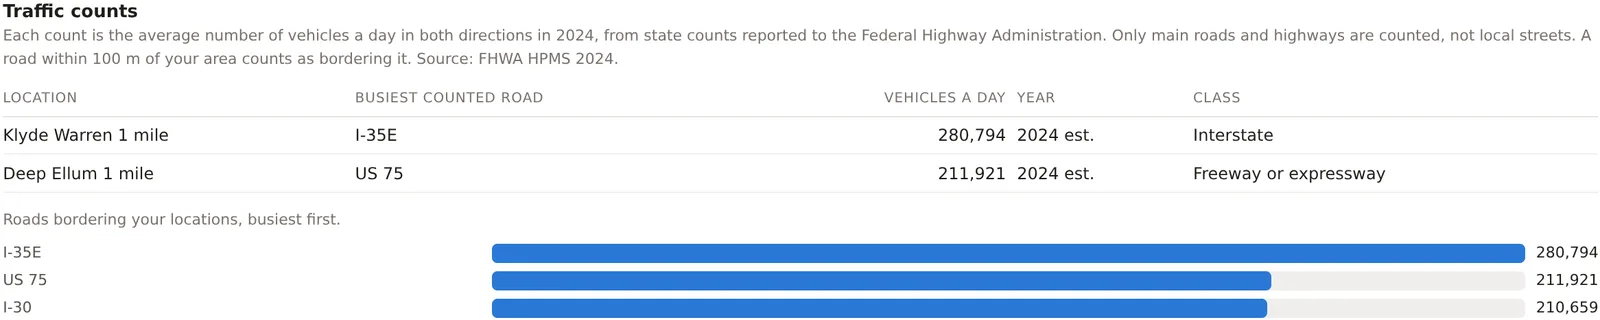
The busiest counted road bordering each location, with its vehicles a day, the year of the count and the road's class, and beneath that every road bordering the project's areas, busiest first, as bars. A count is the annual average daily traffic in both directions as the state reported it to the Federal Highway Administration. Only main roads and highways are counted, not local streets, and a count marked est. is from a year the state did not date. When no counted road borders a location, the card names the nearest within three kilometers and says how far away it is, and when there is none it says so. Part of the Pro and Team plans.
An example
The Downtown Dallas project on 30 October 2026 read a day to night ratio of 6.06, with 220,590 jobs located in its 13 square kilometers in 2023, 96,823 of them office jobs, against 35,377 resident workers. Its residents had a median commute of 18 minutes, 26 percent worked from home, 3 percent commuted by transit and 70 percent held management or professional jobs. Transit access read 98 percent of residents near any stop and 69 percent near a frequent one, with 291 stops and stations inside, and the busiest bordering road, I-35E, carried 280,794 vehicles a day with its busiest hour at 5 pm on Friday. The 220,590 jobs against 44,549 residents is the whole story of a downtown in two numbers, and the reason a lunch business and a grocery store would read the same area so differently.
Things to know
The daytime estimate is not a head count and never claims to be. It is marked approximate and the methodology page says how it is checked.
Jobs lag. The newest LODES year is about two years behind the survey year, and the card shows which year it is.
A road with no count is not a road with no traffic. States count arterials and highways, and quality varies by state.
Transit shares depend on a timetable being loaded for the area's agencies. The methodology page lists the metros covered.
Related pages
The Income & Housing tab comes before this one and The Businesses tab after. The map describes the Day pop, Traffic and Transit layers that show the same data on the map. Travel time areas use the same roads and timetables to draw an area.