Getting started
Start with a location you know and explore its surrounding market. This guide shows how to draw an area, read the results and save locations for comparison. A free account includes radius and custom polygon areas. Paid plans add the other area types and export tools shown here.
1. Drop a pin on a place you know
Sign in and search for an address, city or landmark. Click on the map to draw a radius around a point, then adjust the radius in the toolbar. The analysis panel updates for the selected area.
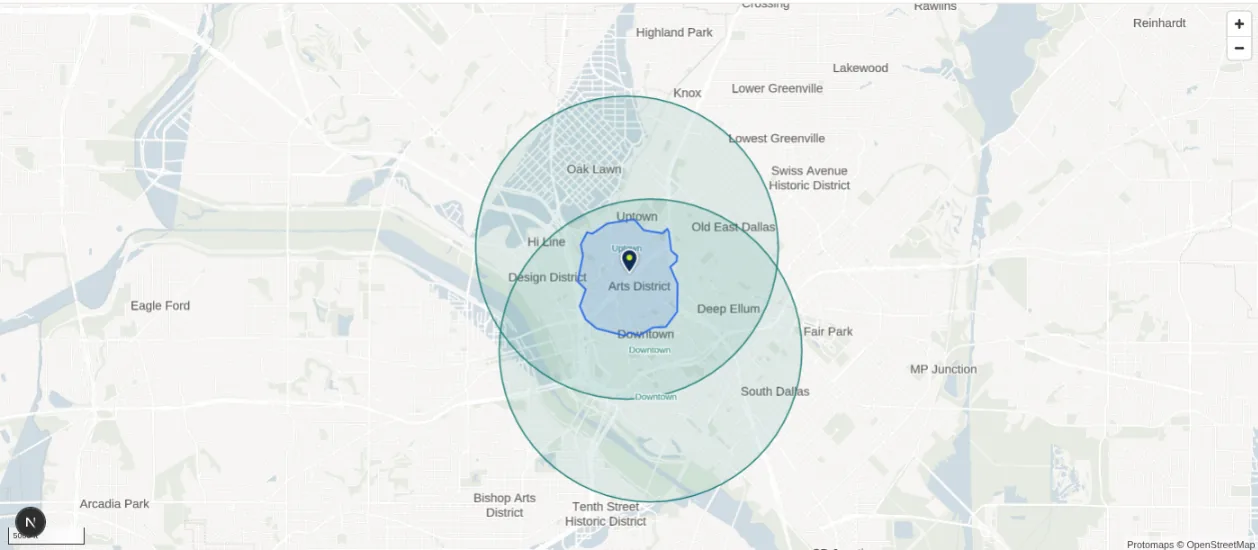
2. Choose the shape that matches the question
Choose Radius for a circle or Polygon to trace a custom boundary. Double-click to finish a polygon. On a paid plan, use Travel time for a driving, walking, cycling or transit area. Rings creates several distance or travel time bands, while Boundary lets you select an existing geographic area.
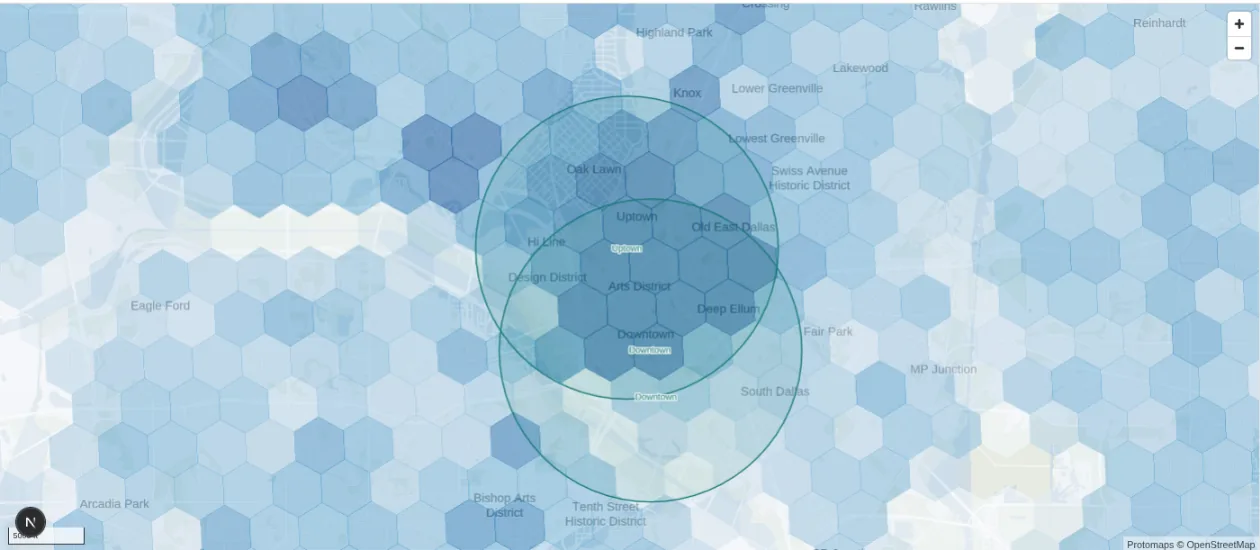
3. Read the panel
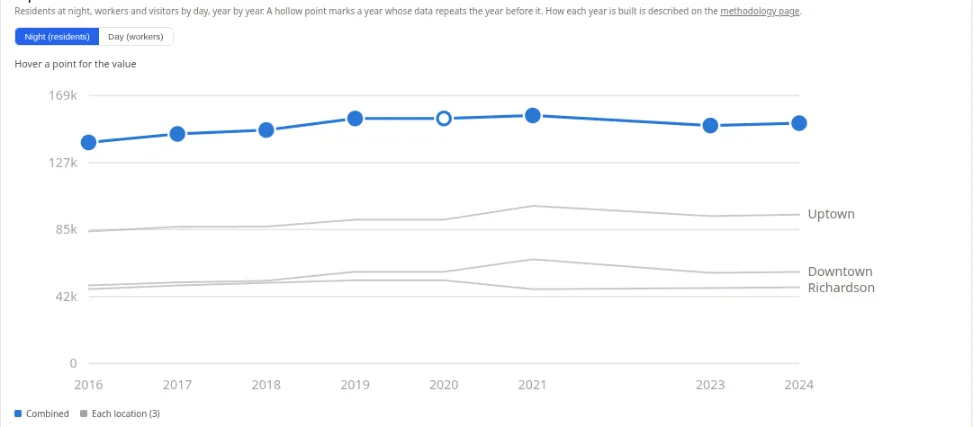
The panel contains Projects, Areas and Analysis. Use Projects to organize your work and Areas to name and save a shape. Analysis displays population, households, income and other measures. Comparison labels show how selected results relate to the wider market. You can also change the population map layer to explore its history.
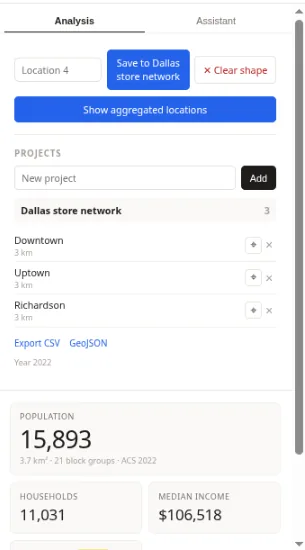
4. Save it to a project
Create a project, name the area and save it. Saved areas remain visible on the map. Add other locations to the same project, then select Analyze project area to review their combined footprint and overlapping population.
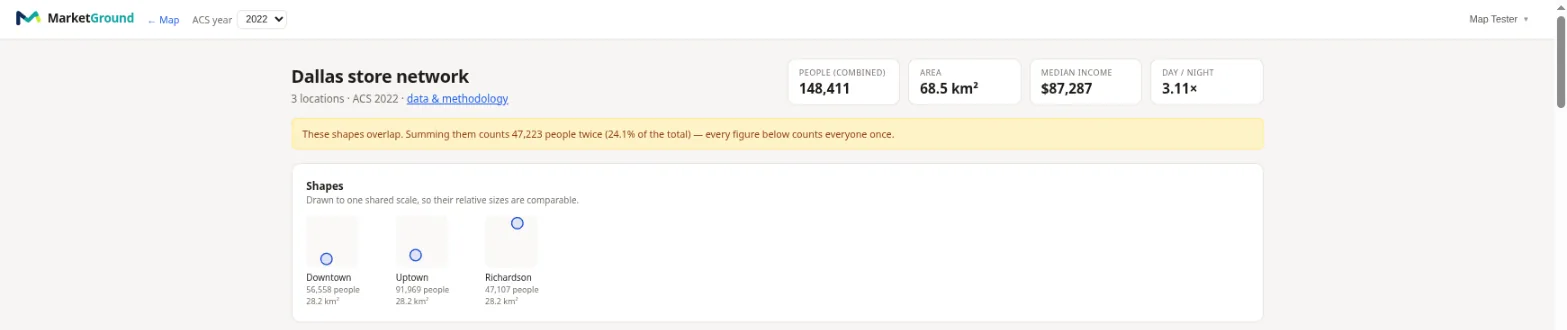
5. Open the full analysis
Select Analyze project area to open the project report. Review the location comparisons and the sections available on your plan. Paid plans include benchmarks, employment measures, combined demographic tables and exports. Use the Assistant tab to ask questions about an area or your saved projects.
Get help with your first analysis
Email contact@marketground.io with your question. The methodology page explains the sources and calculations, and the pricing page shows what each plan includes.
Create a free account to start on a place you know.