Franchise site selection
Evaluate a franchise territory before committing
Compare proposed territories using household estimates, income, age groups and nearby businesses. Define the area using the boundary relevant to your franchise, then prepare a report for discussions with the franchisor or lender.
Every state and the District of Columbia, with the same method applied to every market.
The decision
Understand the market behind the territory
A franchise agreement defines where you can operate and may include a development schedule. MarketGround helps you examine the people and businesses within the proposed area. Two territories with similar populations may differ in household characteristics, competition and overlap with existing locations.
A real example
Three haircut stores in the Dallas suburbs, three miles each.
Suppose you hold a haircut franchise and you have three sites on the table, one beside Legacy West in Plano, one at Firewheel Town Center in Garland and one at Uptown Village in Cedar Hill. Each gets the same three-mile ring, and these are the figures MarketGround returns for them.
| Three miles around | Residents | Households | Median income | Under 18 | Hair salons | Daytime population |
|---|---|---|---|---|---|---|
| Legacy West, Plano | 99,809 | 44,731 | $114,805 | 18,535 | 202 | 239,976 |
| Firewheel, Garland | 99,529 | 34,100 | $96,793 | 22,921 | 40 | 70,559 |
| Uptown Village, Cedar Hill | 48,152 | 16,403 | $96,571 | 13,008 | 39 | 39,293 |
Swipe the table sideways to see every column.
The table compares three-mile areas around each location. Salon counts refer to listed places in that category. Sources and data periods are described on the methodology page.
Plano and Garland hold almost exactly the same number of residents, 99,809 against 99,529, and a flyer quoting population alone would call them equivalent. They are not. Plano has 202 hair salons inside the ring and Garland has 40, so each Garland salon has about 2,500 residents behind it against 494 in Plano. Plano answers with income and with its daytime crowd, $114,805 against $96,793 and 240,000 people present during the working day against 70,000, because the ring covers an office district as well as houses.
Cedar Hill is the smallest of the three at 48,152 residents, yet it carries as many salons as Garland, which leaves 1,235 residents per salon. It does have the youngest profile, with 27 percent of residents under 18 against 19 percent in Plano, which matters if your brand sells family haircuts rather than fades for young professionals.
Plano has higher household income, a larger estimated daytime population and more listed salons. Garland has fewer salons per resident, while Cedar Hill has a smaller population and a larger share of children. These differences can help you evaluate how each market fits your concept.
Comparing candidates
Compare every site on one page
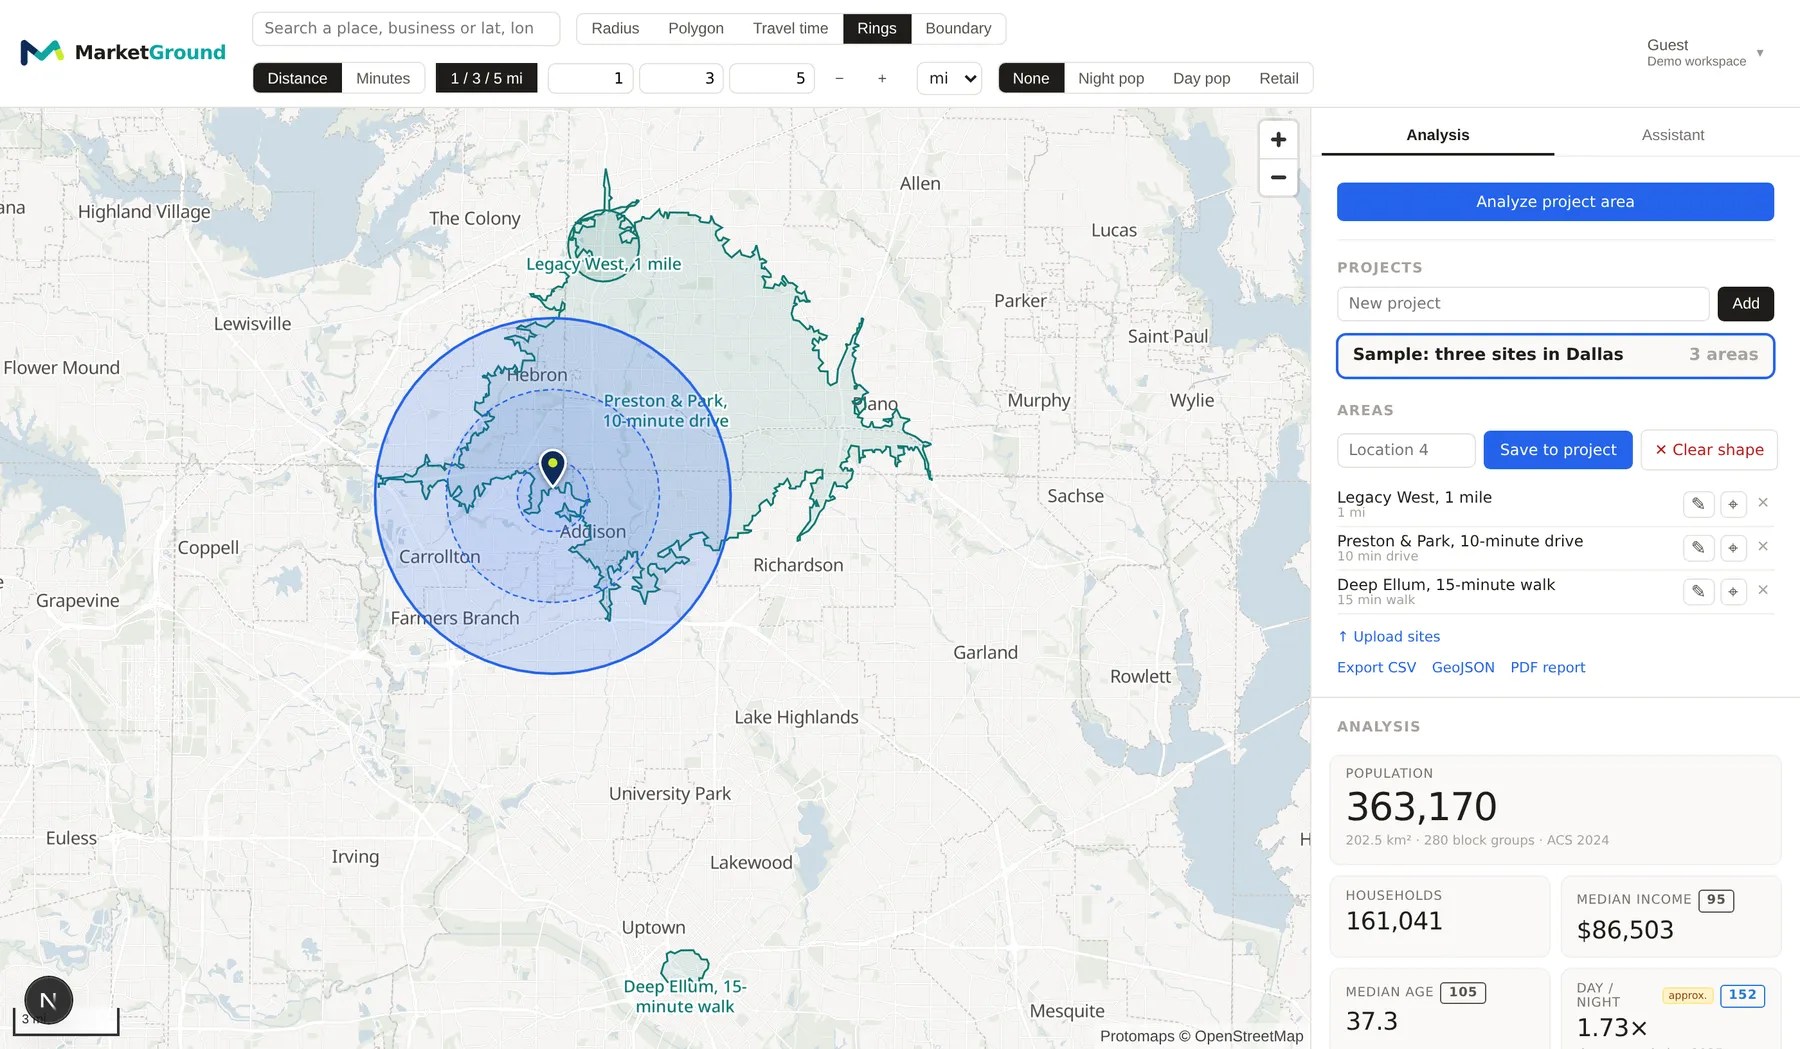
Save candidates in one project to compare their measures and review the combined area. The report accounts for overlaps and shows the shared population. Use it to compare proposed territories with existing locations.
Index scores put each site against its own city, county and metro, so a median income of $114,805 is read as 26 percent above the Dallas-Fort Worth metro rather than as a figure floating on its own. A franchisor comparing markets across the country needs that, because $96,000 means one thing in Texas and another in Ohio.
See the full comparison report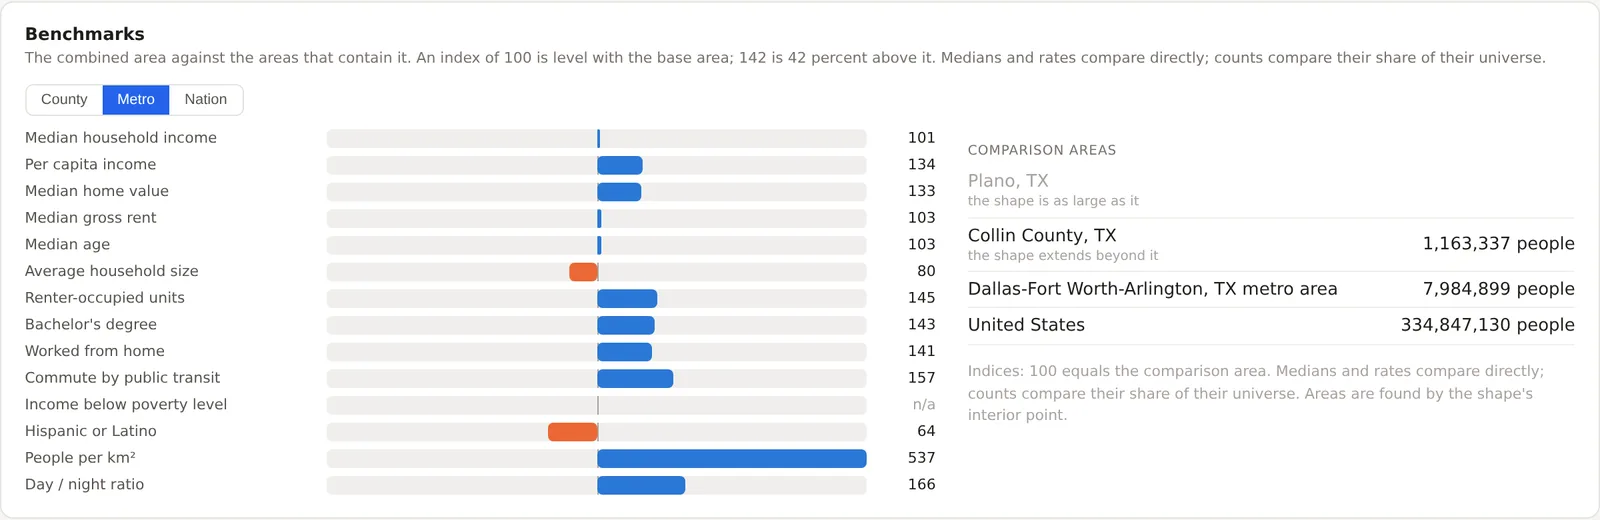
What franchisees and franchisors use it for
Compare territory options
Review household estimates within the boundary described in the agreement and compare candidate sites using consistent areas. Examine overlap when planning additional units. Export a report with your branding to support discussions about territory selection and development.
Questions
Questions people ask
How do I size a franchise territory?
Most franchisors define a territory by a radius, a drive time or a set of ZIP codes, and often by a population floor such as 40,000 households within three miles. MarketGround draws all three kinds of boundary and gives you the household count for each, so you can check a proposed territory against the floor in the agreement before you sign it rather than afterwards.
Can I compare a long list of candidate sites at once?
Yes. Upload a spreadsheet of addresses, a set of pins or a file of trade areas, choose a default area such as a three-mile ring or a ten-minute drive, and every row becomes a saved area in one project. The comparison page then puts each location against the others on every measure, and paid plans import up to 1,000 areas a day.
Will this satisfy a franchisor or a lender?
The PDF report includes your branding, data sources and methodological notes. Use it to support discussions with a franchisor or lender about the proposed territory.
How do I handle territories that overlap?
Combined project results include the shared population once and show the extent of the overlap. Use that information alongside customer and sales data to assess how another unit might affect existing locations.
Does it tell me what competitors earn?
MarketGround shows listed competitors by category and brand, along with the surrounding population and households. These measures help you compare the local business mix across candidate areas.
Can I use it outside the United States?
Not yet. The population, demographics, employment and boundary data behind MarketGround are United States sources, and the product covers all fifty states and the District of Columbia.
Case study
A related example
Keep reading
Explore the methods and related guides
Read the methodology for sources and calculations, explore the features page or follow the getting started guide. The research section includes studies and practical examples of location analysis.
Define an area and explore its population, income and listed businesses.
Compare candidate stores using nearby households, daytime population and listed businesses.
Compare residents, daytime population and restaurants around potential locations.
Add population, employment, income and travel access information to property analysis.
Compare estimated daytime population with residents for the area you choose.
Review a proposed territory
Draw the boundary described in the agreement and examine the households, businesses and overlap with existing locations. Use the results to prepare specific questions about the territory.