Retail site selection
Compare potential retail locations
Evaluate candidate sites using nearby households, income, daytime population and listed businesses. Apply consistent area definitions and bring the results together in a report.
Every state and the District of Columbia, with business listings refreshed every month.
The decision
Add market data to your site visits
A visit helps you assess parking, visibility and surrounding tenants. MarketGround adds information about the households, income and businesses in the surrounding area. Compare these measures across candidates to identify differences that deserve a closer look.
A real example
One, three and five miles around a site, in one click.
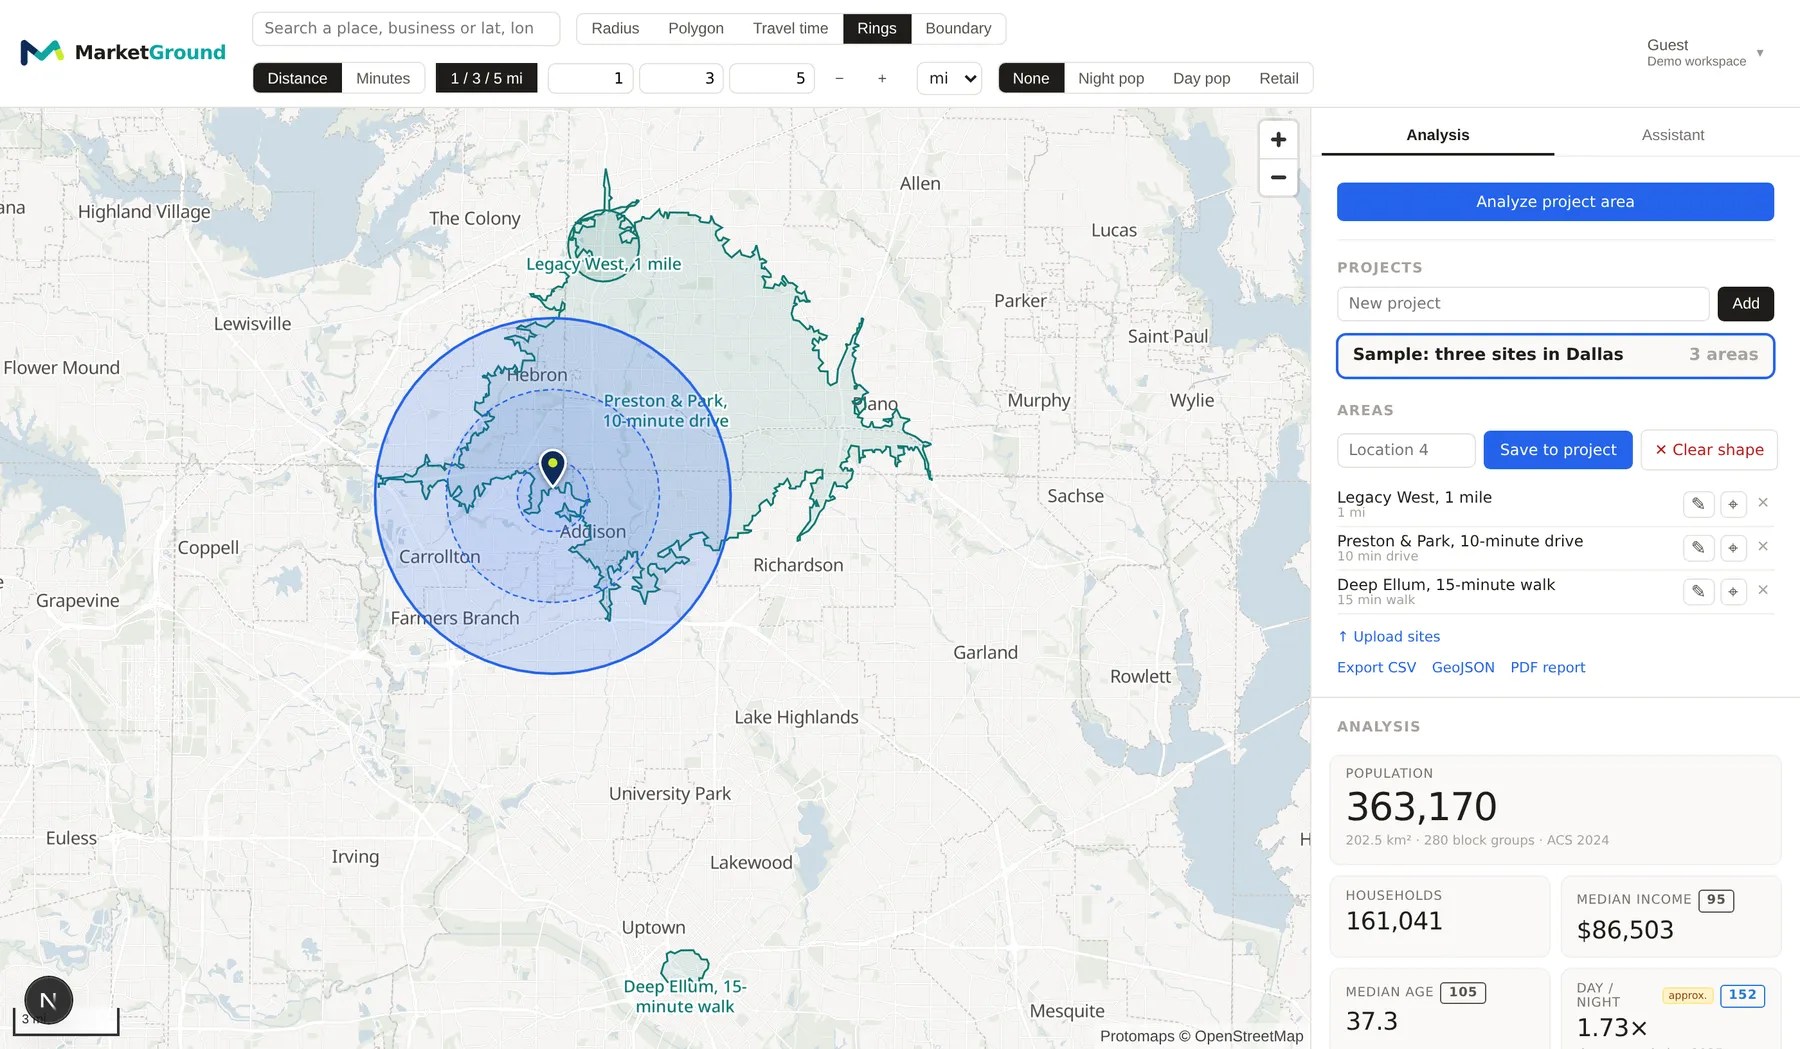
Rings mode drops all three bands at once and analyzes each of them. In the picture below the point sits in Addison, north of Dallas, and the panel is reporting the outermost band, 363,170 residents across 202.5 square kilometers drawn from 280 census block groups, with a median household income of $86,503 and 1.73 times as many people present by day as by night.
Reading the bands
See how the market changes with distance
The table shows one, three and five miles around Legacy West in Plano. Each distance covers a different population and income distribution. Compare the additional households and businesses as the area expands, then choose the distances that best match your customers.
| Within | Residents | Households | Median income | Daytime population |
|---|---|---|---|---|
| 1 mile | 7,891 | 4,624 | $96,366 | 79,980 |
| 3 miles | 99,809 | 44,731 | $114,805 | 239,976 |
| 5 miles | 317,427 | 129,660 | $118,174 | 485,360 |
Swipe the table sideways to see every column.
Legacy West in Plano, Texas. The table compares cumulative areas around the same location. See the methodology page for sources and data periods.
The competition
Compare the businesses already listed nearby
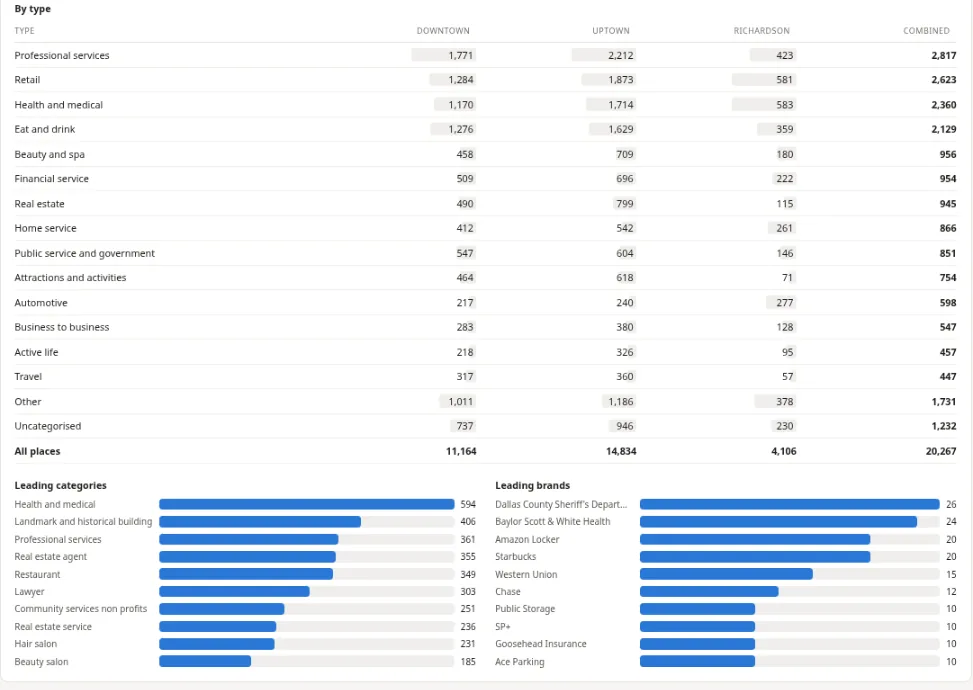
Within three miles, Legacy West has 10,514 listed businesses, including 1,194 retail locations and 932 eating and drinking places. Firewheel Town Center has a similar resident population but 2,610 listed businesses, including 474 retail locations. The difference describes business density. Review the relevant categories before drawing conclusions about direct competition.
The table breaks every location down by type, then lists the leading specific categories and the leading brands, so a hardware retailer can see the hardware stores and a pharmacy can see the pharmacies rather than a single number for retail.
How people work through a shortlist
Work through a shortlist
Import your candidate locations and choose consistent radii, rings or travel times. Save them in one project to compare their demographics and listed businesses. Use regional benchmarks to interpret the differences, then export the results as a spreadsheet, geographic file or PDF with your branding.
What it costs
A flat monthly price, with the free plan enough to test it.
Pro is $79 a month for a single seat, with unlimited projects, unlimited saved areas, rings, travel areas, named boundaries, all 250 demographic measures, jobs by industry, benchmarks, exports and the PDF report. Team is $59 per seat a month for five seats or more and adds shared projects across your office. The free plan gives you one project, four saved areas and the core demographics, which is enough to run a site you already know and judge the numbers for yourself.
Questions
Questions people ask
How large should a retail trade area be?
Start with distances or travel times that reflect your format and available customer information. One, three and five mile rings provide a consistent comparison across sites. Travel areas add information about access. A convenience store and a destination retailer may need very different boundaries.
Can I see what is already trading there?
Yes. Every listed business and place inside the area is counted by category and by brand from Overture Maps, refreshed every month. You see how many pharmacies, salons, restaurants or hardware stores are inside the outline, and which brands they belong to.
Does it handle overlapping sites?
Yes. Combined project results account for overlapping areas and report the shared population. This helps you compare the geographic coverage of existing and proposed locations.
Can I bring a list of sites I am already looking at?
Upload a spreadsheet of addresses or coordinates, a GeoJSON or KML file, or a zipped Shapefile, and every row becomes a saved area in one project, analyzed and ready to compare. Choose a default area such as a one-mile radius or a fifteen-minute drive, and any row carrying its own radius or polygon keeps it.
Does it include sales, foot traffic or credit card spending?
MarketGround provides population, demographic, employment and business listing data. Use these measures alongside your sales and customer information when evaluating a location.
How current is the data?
Business listings are refreshed monthly. Demographic, population and employment information follows the relevant source releases. The methodology page provides the data periods and update details.
Case study
A related example
Keep reading
Explore the methods and related guides
Read the methodology for sources and calculations, explore the features page or follow the getting started guide. The research section includes studies and practical examples of location analysis.
Define an area and explore its population, income and listed businesses.
Compare proposed franchise territories using consistent areas and a report you can share.
Compare residents, daytime population and restaurants around potential locations.
Add population, employment, income and travel access information to property analysis.
Compare estimated daytime population with residents for the area you choose.
Compare locations you already operate
Analyze a stronger and a weaker location using the same area definition. Look for differences in the surrounding markets, then compare them with your sales and operating experience.