Features / Define an area
Define the area you want to understand
Every figure in MarketGround is computed for a shape you choose. Draw it, let the road network draw it for you, pick a named boundary, or bring in the sites you already have.
Draw
Choose an area to analyze
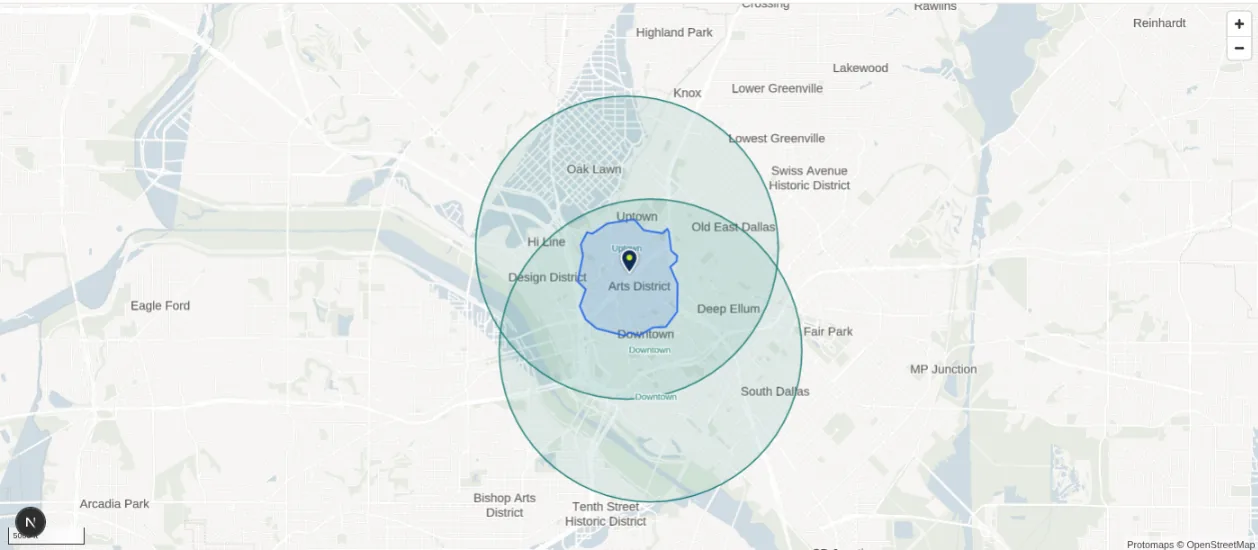
Draw a radius around a point, trace a custom boundary or choose a travel time by car, on foot, by bicycle or by public transit. Travel areas follow the available network and routing assumptions, so a ten-minute drive reaches further along an arterial than across a grid of local streets. The example shows a 15-minute walking area around Klyde Warren Park, with a previously saved area to the east. Radius and polygon areas are included on every plan, and travel-time areas are included on Pro, up to 60 minutes, and on Team, no cap.
Rings
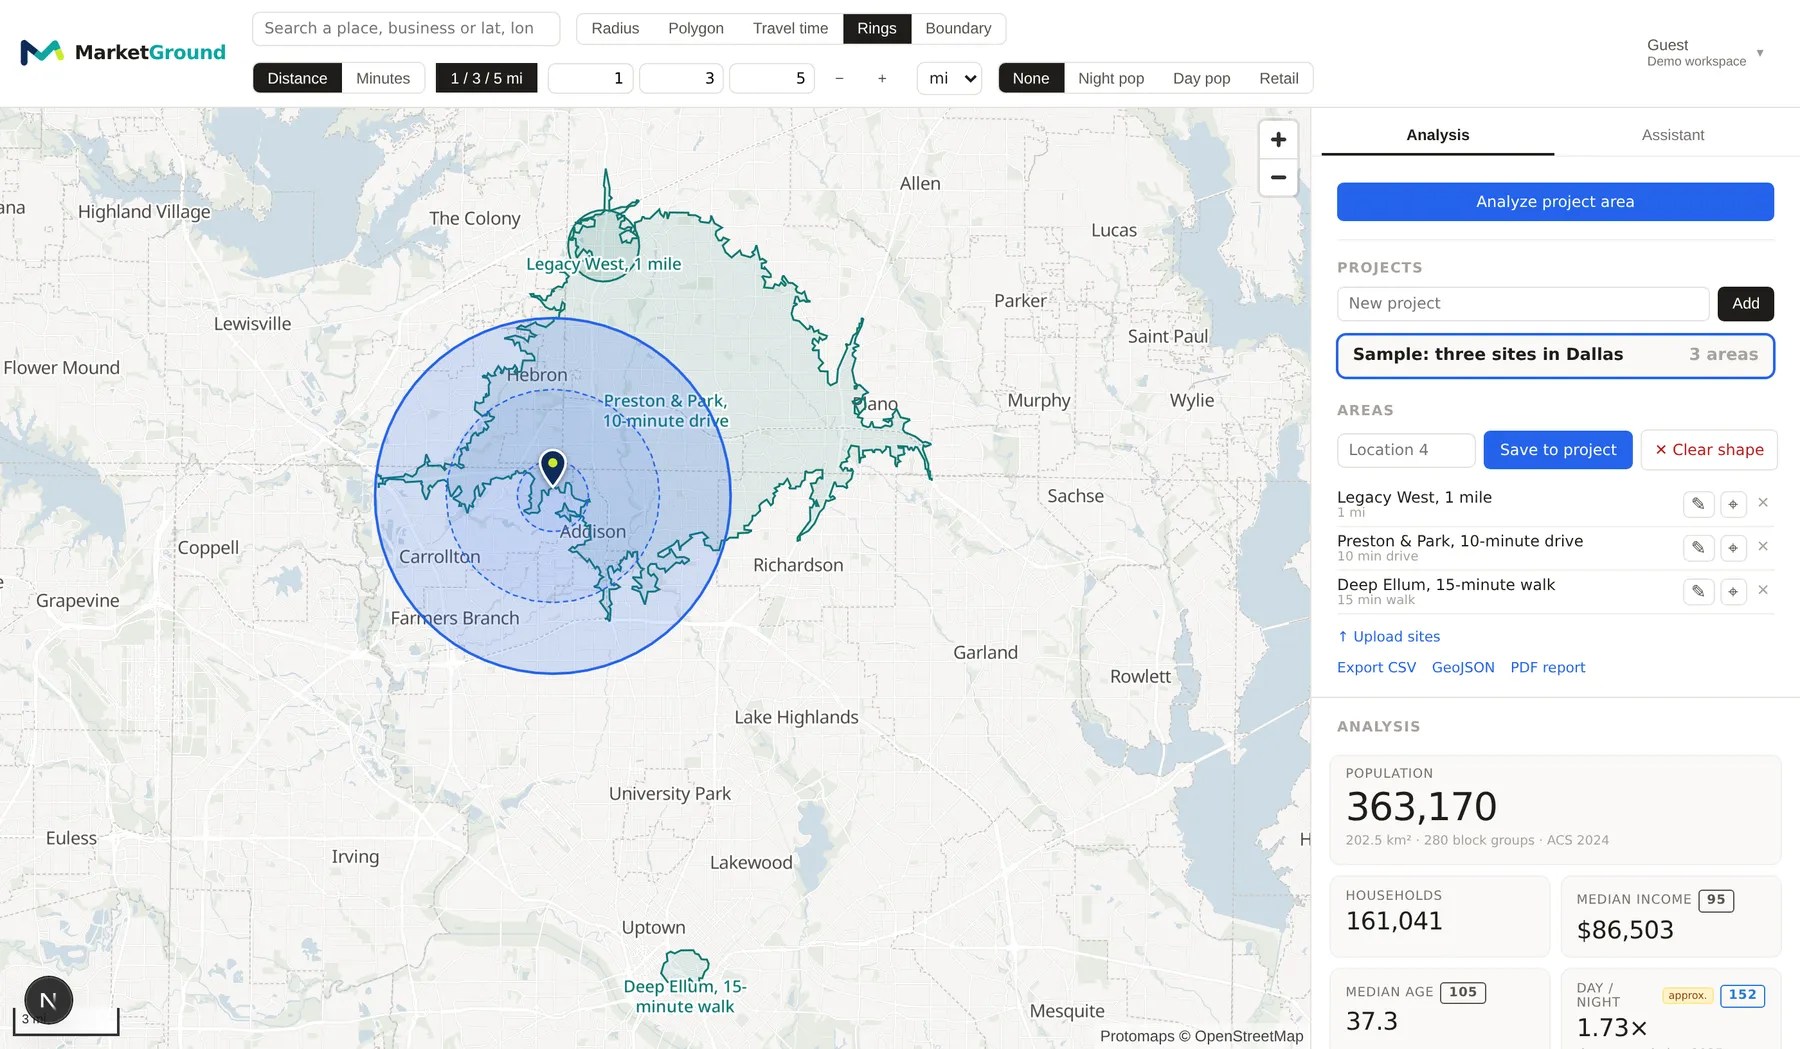
Compare distance and travel time rings
Create up to four bands around one location, using distances or travel times. MarketGround reports cumulative areas and the additional area between bands, so you can see what the third mile adds that the first two did not. Saved bands appear in reports and exports, and median values are calculated from the underlying distributions for each cumulative ring. Included on Pro and Team.
Named boundaries
Analyze a named geographic area
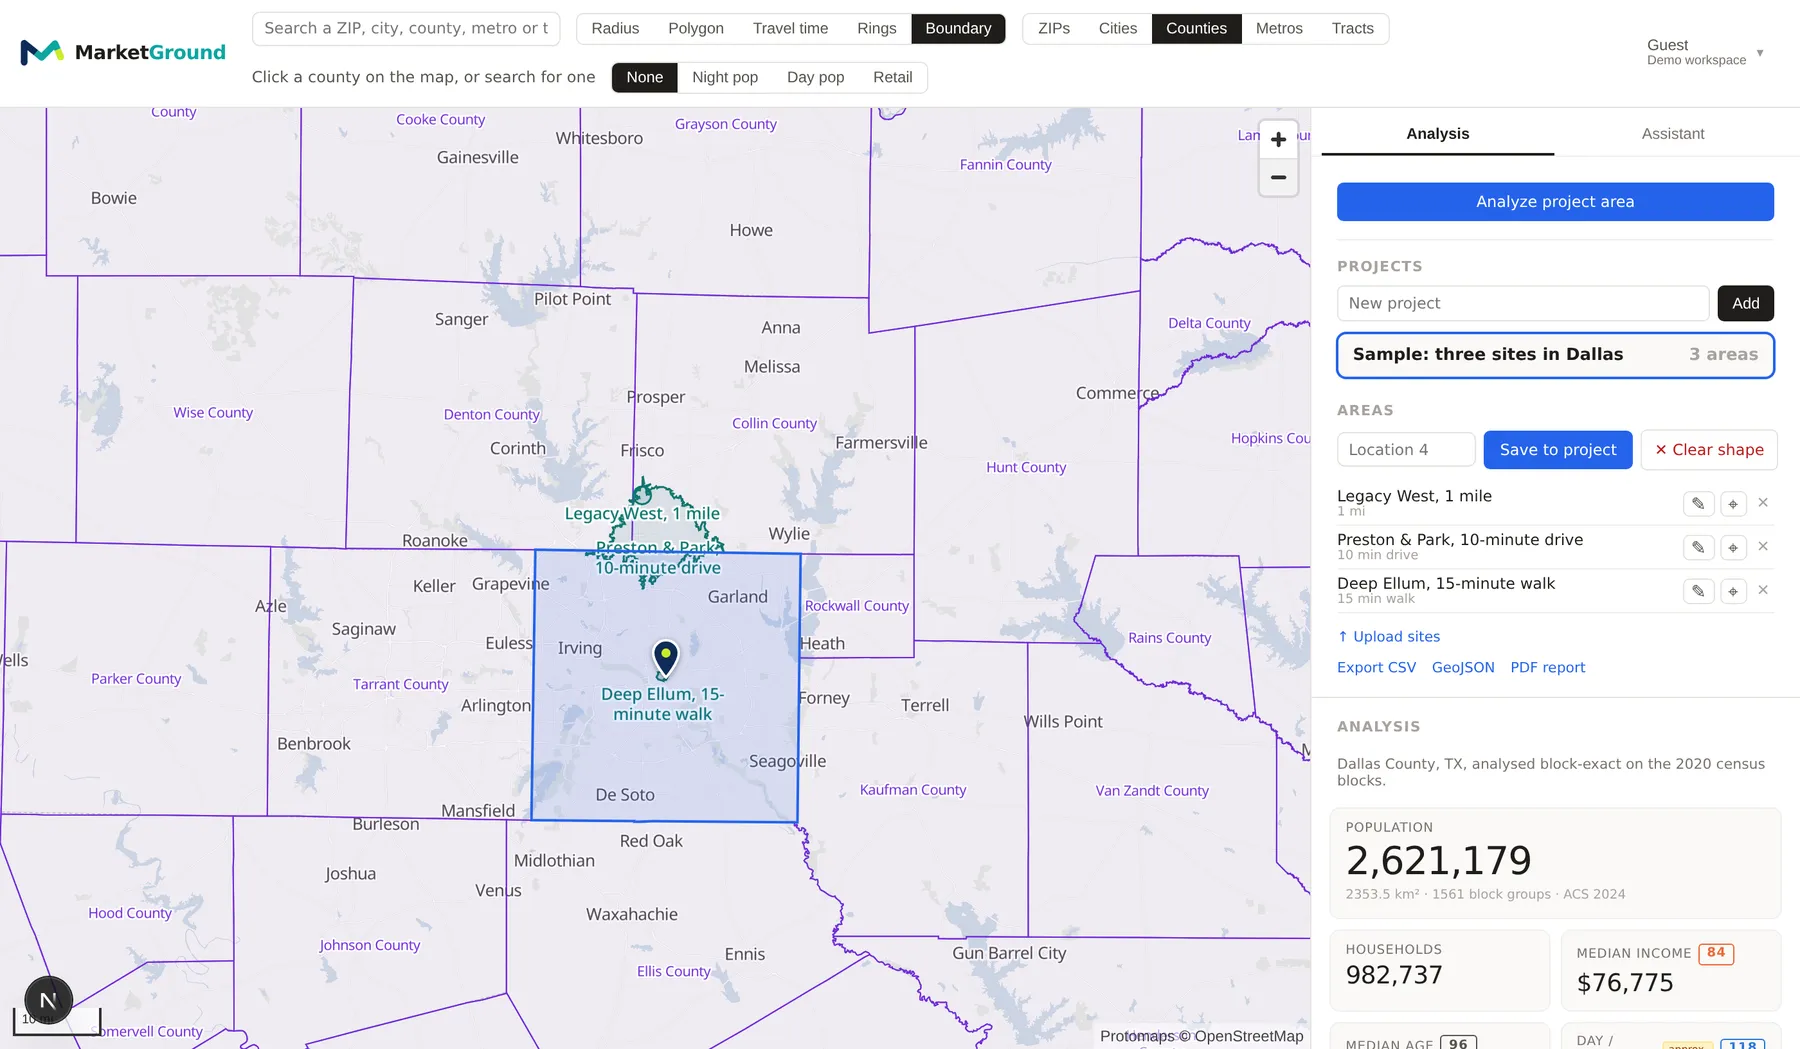
Choose a ZIP area, city, county, metro area or census tract from the map or search box. MarketGround analyzes that boundary so you can compare a site with the surrounding region. Counties and census tracts are assembled from their component block groups, and other boundaries can require geographic allocation, as explained in the methodology. Included on Pro and Team.
Upload your own sites
Import the locations you already have
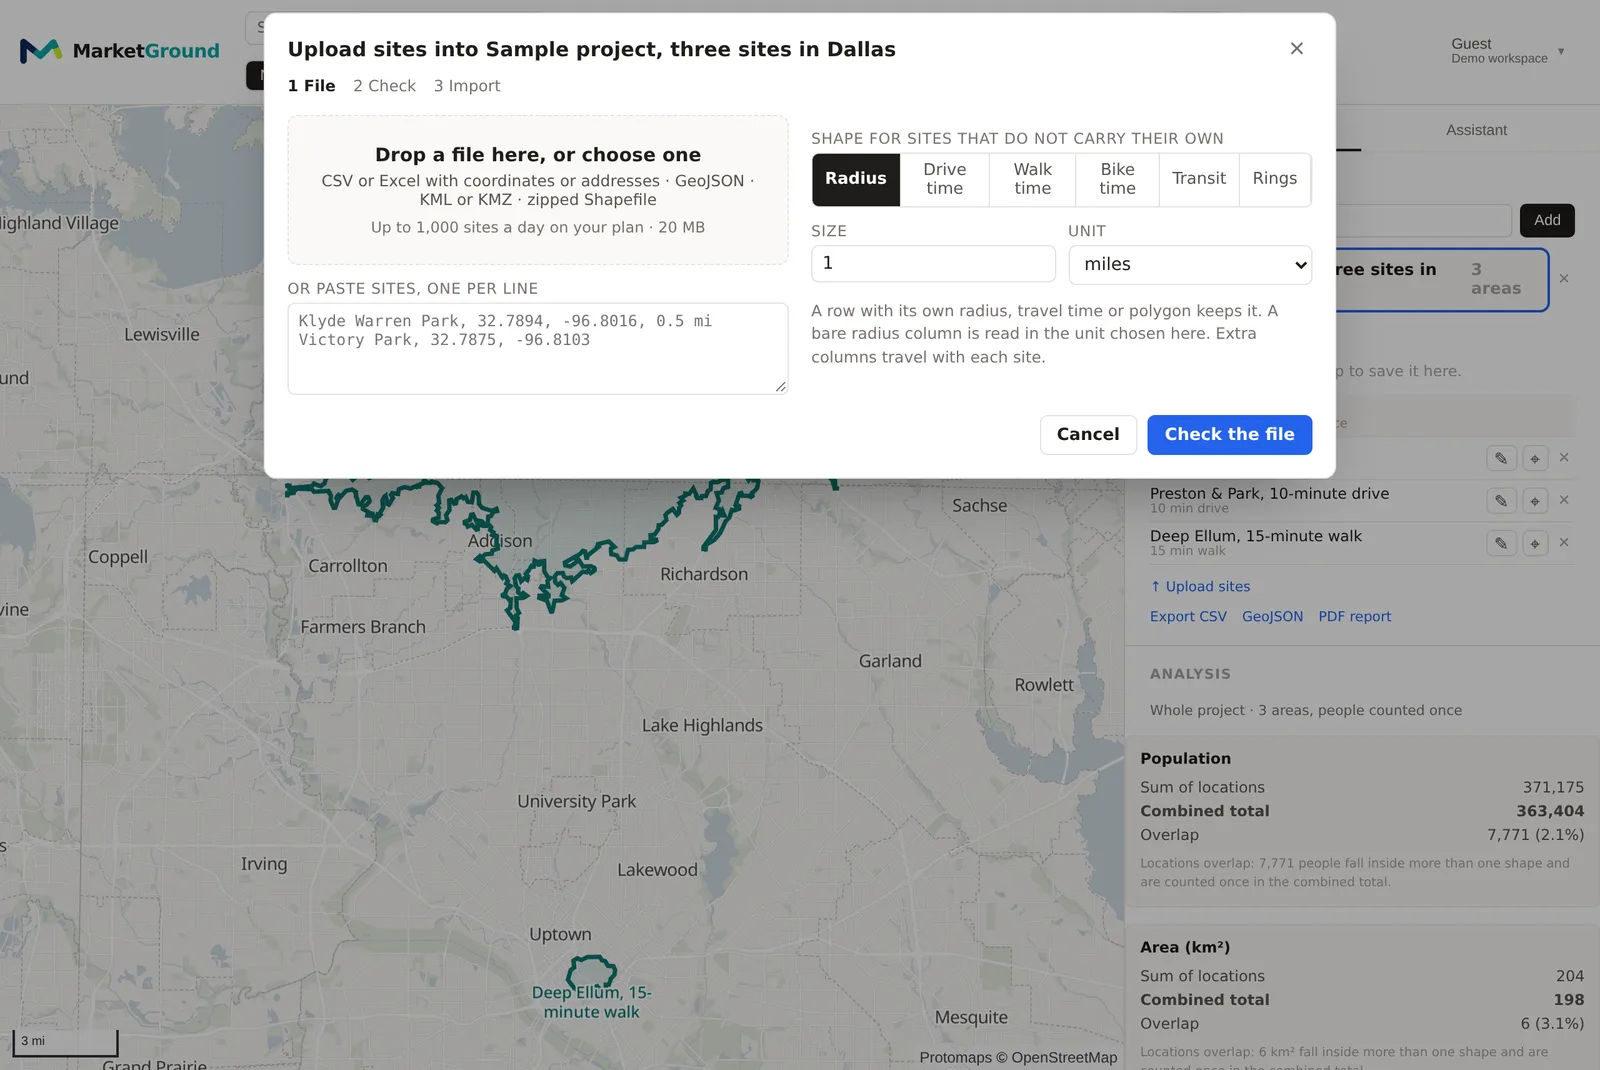
Upload a spreadsheet of addresses or coordinates, a GeoJSON or KML file, or a zipped Shapefile, or paste a few sites one per line. Choose a default area for the imported locations. Rows with their own supported area settings retain them, and additional fields such as rent or square footage remain with each site. Uploads are included on Pro and Team, 1,000 areas a day, with no limit on manually drawn saved areas.
Instant results
Review results beside the map
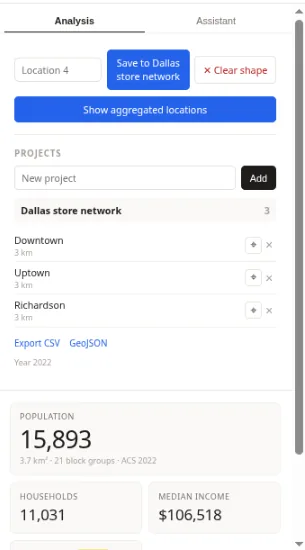
The analysis panel updates when you draw or change an area. The walking area shown here has an estimated 13,319 residents, 9,284 households and a median household income of $119,819. Comparison labels show how measures relate to the metro area. Use the Projects and Areas sections to organize your work, save a location or export results on a paid plan.
Keep reading
The features beside these
Every feature is listed by plan on the features page, and how each figure is built is on the methodology page.