Features / Who is there
Know who is there, by night and by day
Residents, workers and the people an area draws in during the day, with the Census tables that describe them, their history back to 2016, the comparison with the wider market, and the uncertainty on every survey figure.
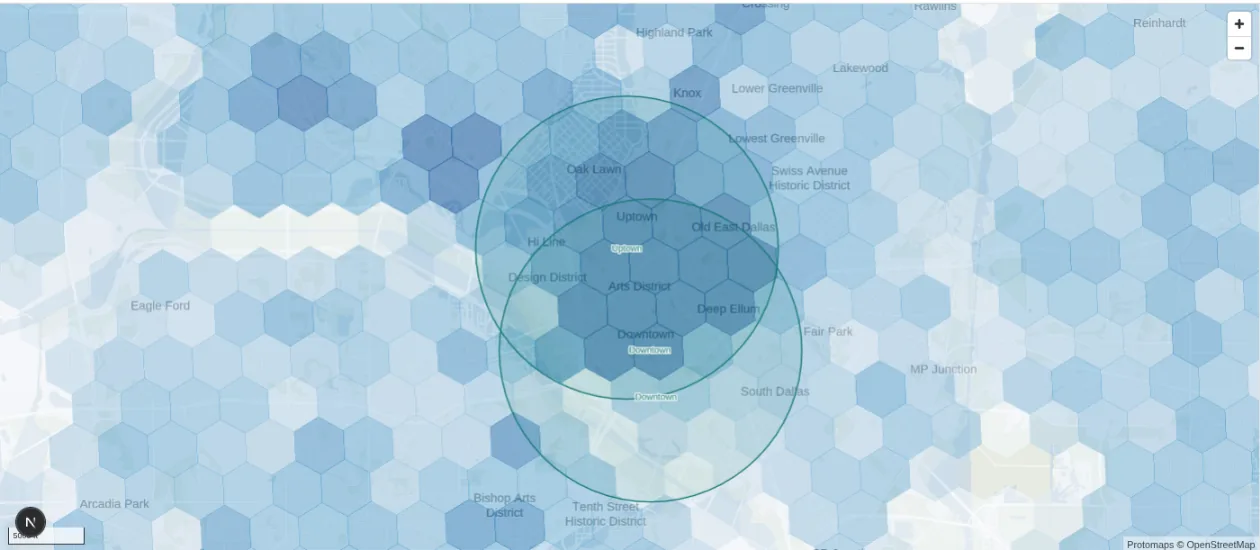
Day and night population
Compare population by day and night
Each area includes resident and daytime population measures. Their ratio shows whether the estimated daytime population is larger or smaller than the resident population, so an office district reads several times its resident count and a suburb reads below one. Turn on the population layer to explore patterns across a city before selecting an area. Included on every plan.
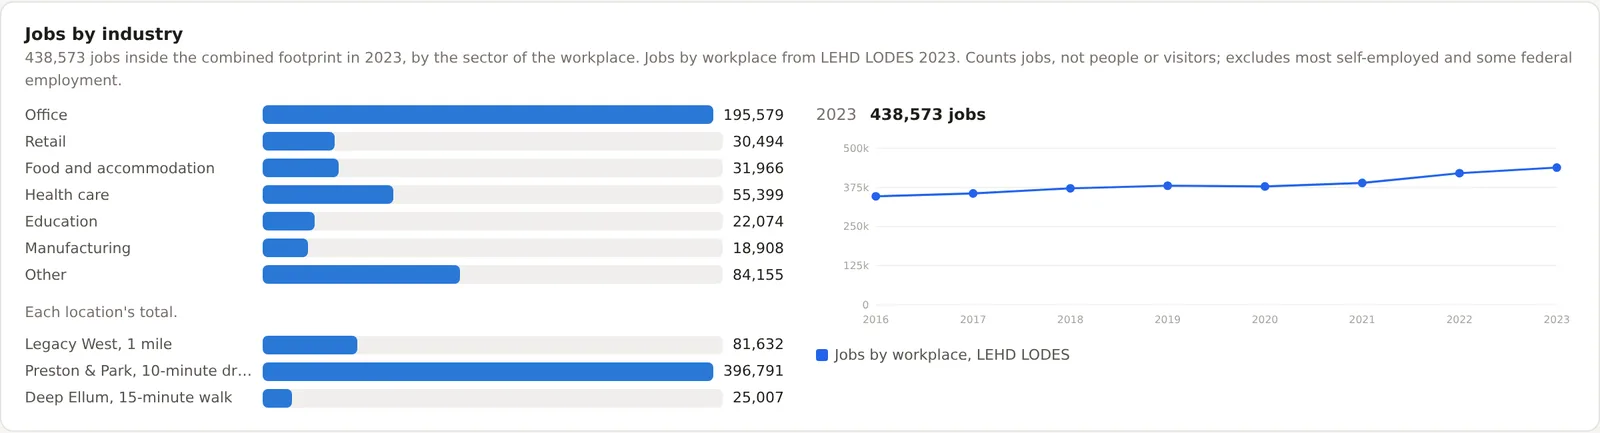
Jobs by industry
See jobs by industry
Explore jobs at workplaces within your area, grouped by industry. The figures come from Census Bureau employment data, with history available to show how the local employment mix has changed. Read the office and health care counts as the daytime customers a site can reach, and the retail and food counts as the businesses already serving them. Included on Pro and Team.
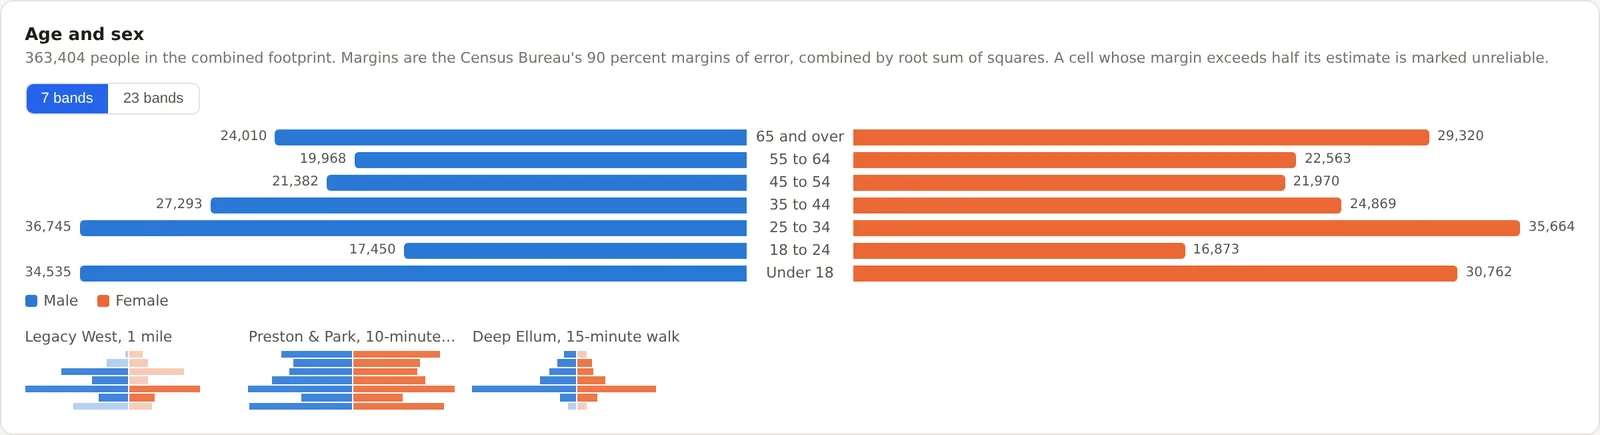
Age by sex, and four more combined tables
Explore combined demographic characteristics
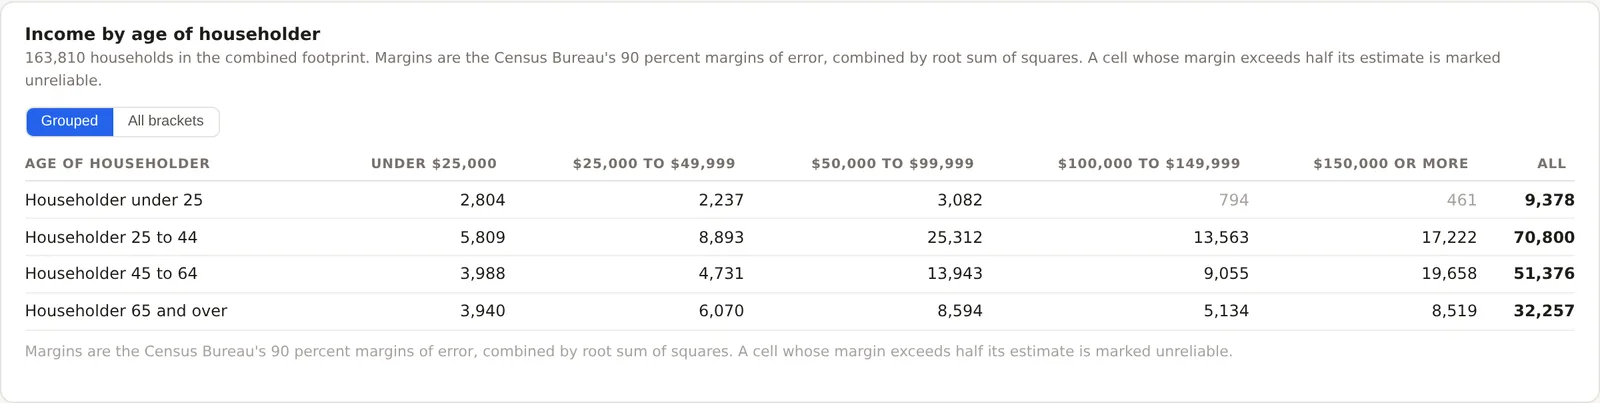
View age and sex together using the Census Bureau tables that publish both characteristics. MarketGround estimates these groups for your selected area. Choose seven grouped age bands or all 23 Census bands. Additional tables cover housing tenure and income by age of householder, households with children, and education by sex. Included on Pro and Team.
Population over time
Review population history
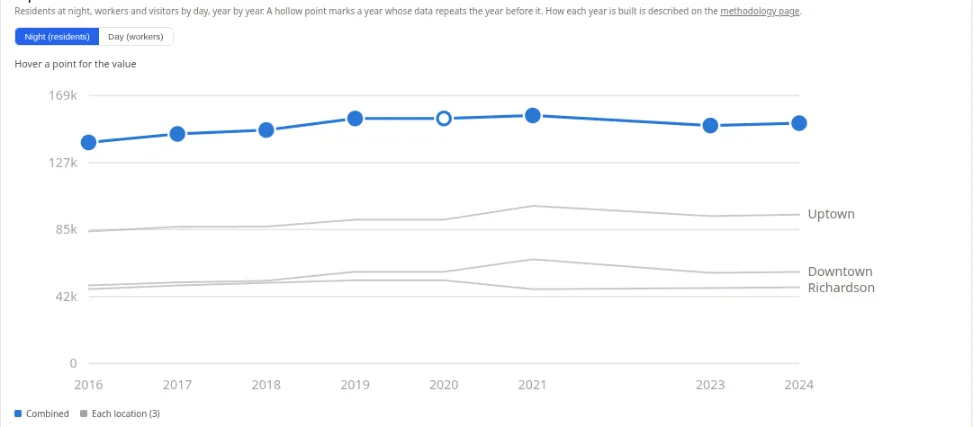
Project reports show population history for each location and the combined area. Switch between resident and daytime measures and use the table to inspect values. LandScan and Census-based results appear as separate series, with their source details explained on the methodology page. Included on every plan.
Benchmarks and index scores
Put local figures in context
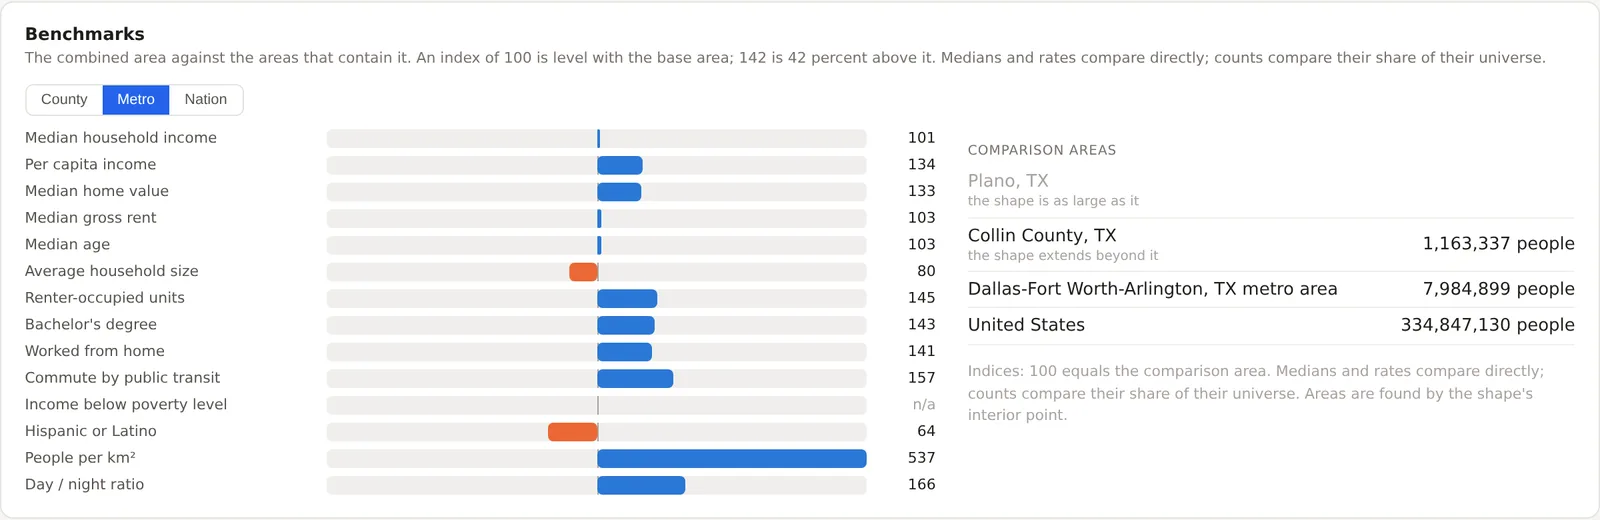
Compare an area with its city, county, metro area or the nation. An index of 100 matches the comparison area, so a renter index of 145 means the share of rented homes is 45 percent higher. Counts with a defined comparison population are converted to shares before indexing, and every tile on the overview carries its index as a small chip. Switch between benchmarks to see how the area relates to different regions. Included on Pro and Team.
Margins of error
See how certain each figure is
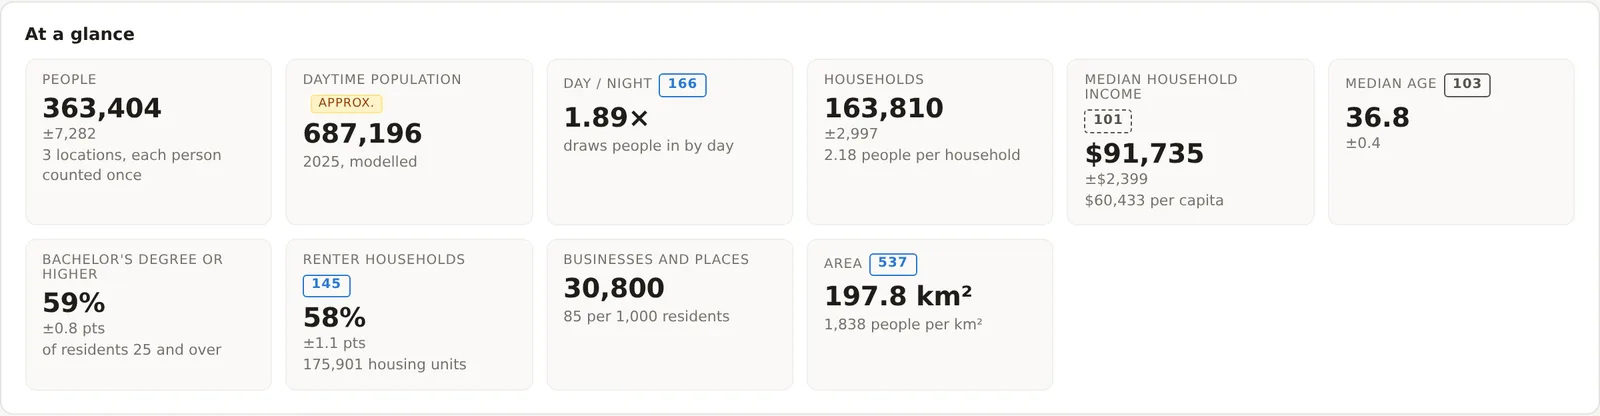
Every figure drawn from the American Community Survey is an estimate from a sample, and MarketGround carries the Census Bureau's 90 percent margin of error through every calculation and shows it beside the number as a range. Nine times in ten, a complete count would fall inside that range. A figure whose margin is more than half the estimate is faded and marked as low reliability, so a small area never presents a guess as a fact. Read how the ranges are built on the methodology page. Margins of error are included on every plan.
Keep reading
The features beside these
Every feature is listed by plan on the features page, and how each figure is built is on the methodology page.
Draw a radius, a polygon or a travel time, analyze rings and named boundaries, or upload the sites you already have.
Traffic counts through the week, when the area is busy, transit access, the Retail map layer, businesses by category and brand, openings and county momentum.