Features / Deciding and delivering
Judge the sites, record the choice and deliver the report
Bring every saved location together, score each against the criteria you already use, test whether the ranking survives other assumptions, keep a record of what was chosen and why, and hand the client a report or a link.
Projects
Every saved location, together and side by side
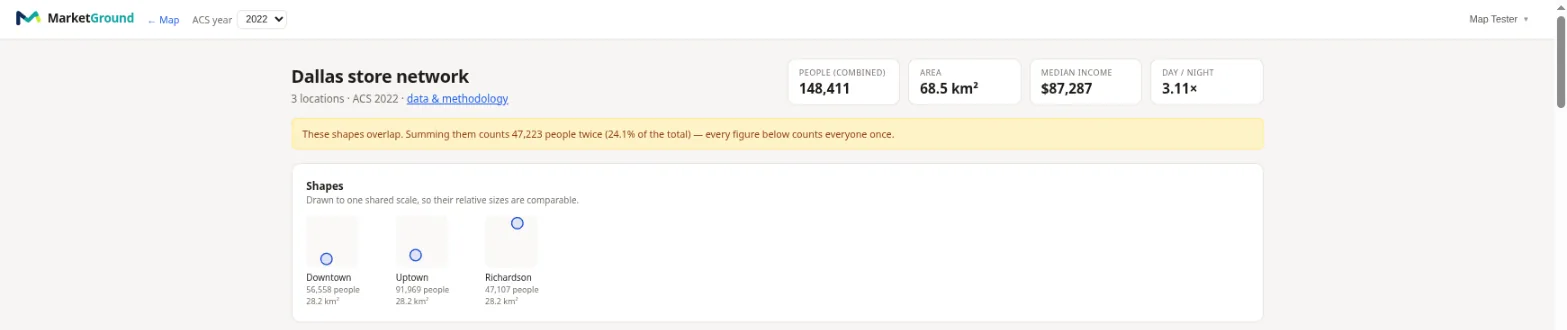
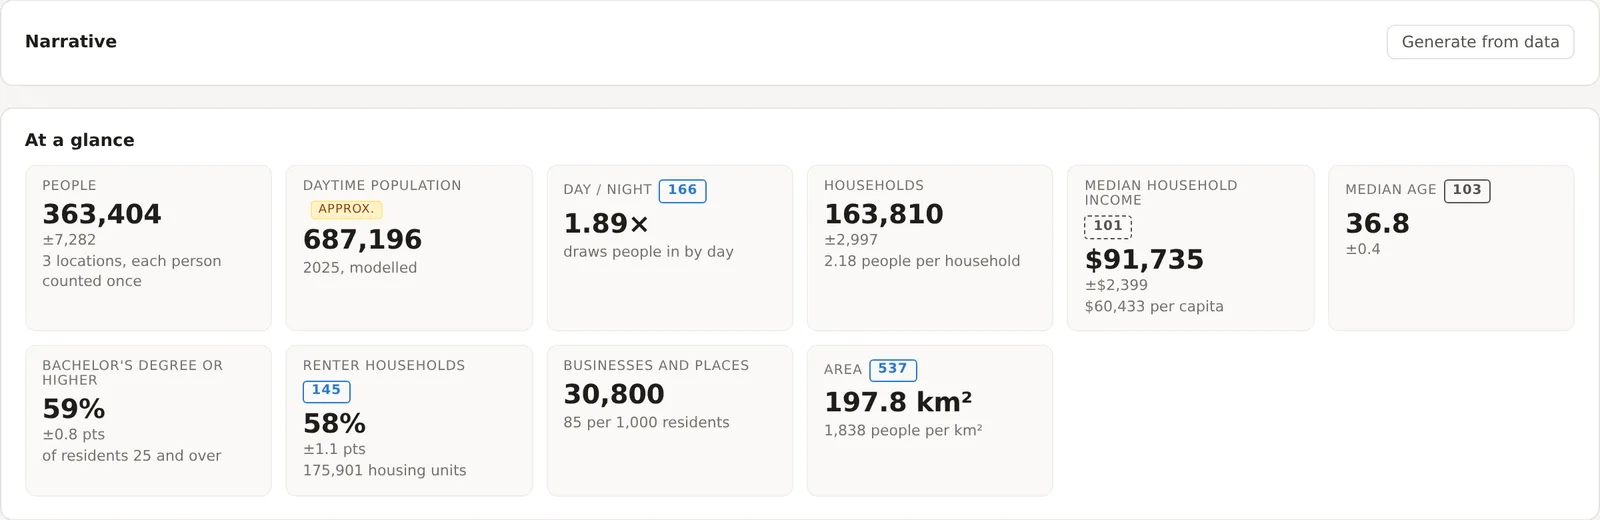
Save areas into a project and open its report. The header gives you the combined picture, here 363,404 people across three Dallas locations covering 197.8 km², with a median income of $91,735 and 1.89 times as many people present by day as by night. Because two of these areas overlap, the page says so at the top and counts the 7,771 shared people once. Each figure carries its index against the metro, so the renter share at 145 and the day and night ratio at 166 are readable at a glance. Free includes one project with four saved areas, and Pro and Team have no limit on either.
Site criteria screener
Score every site against the client's sheet
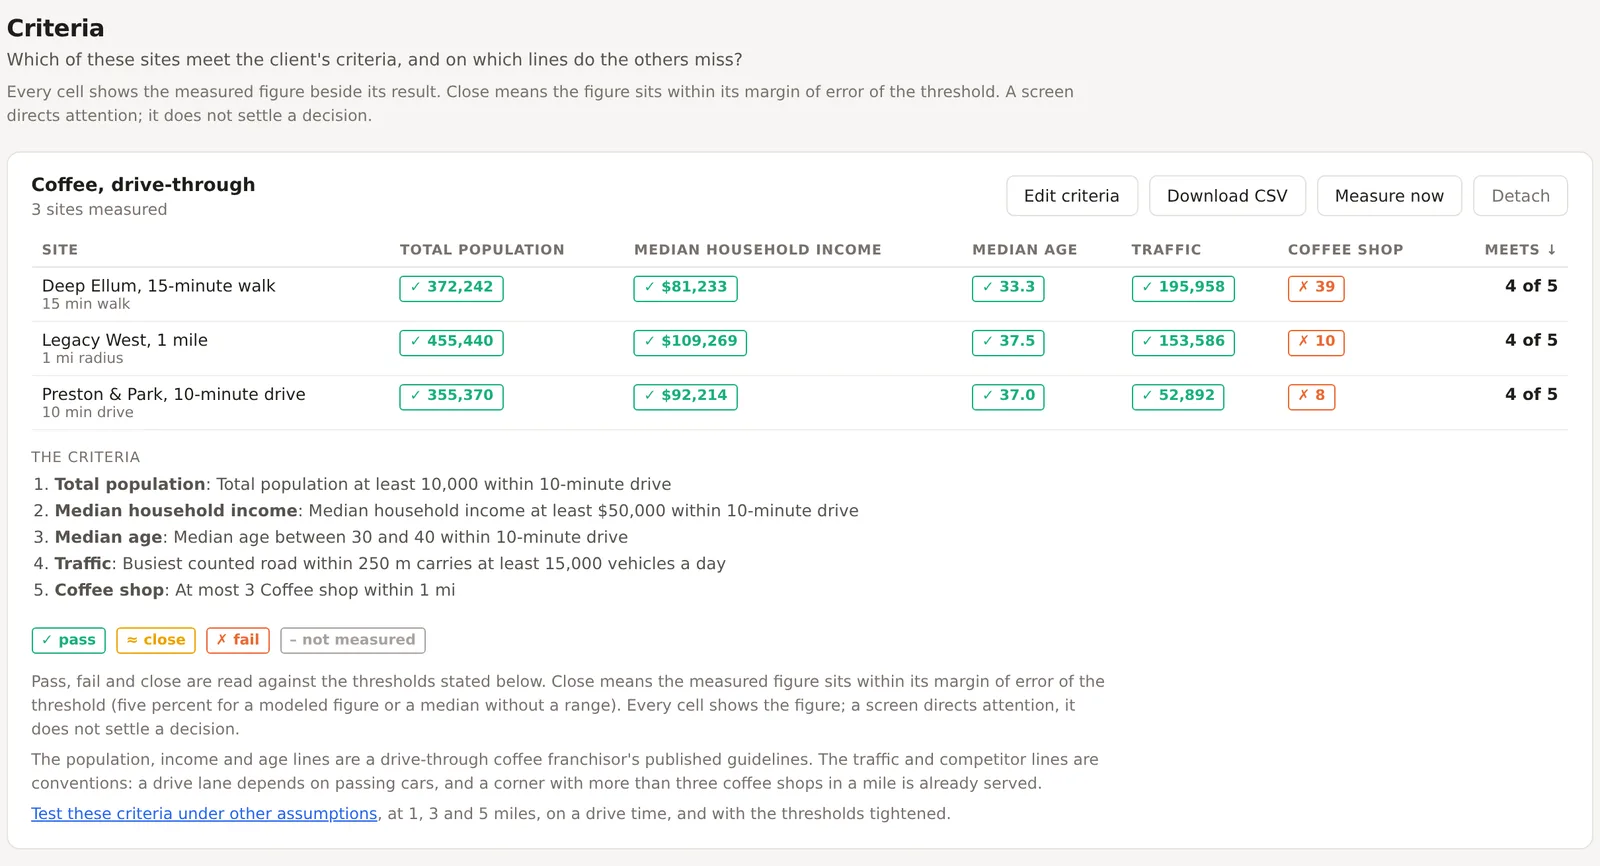
Enter the thresholds a tenant rep carries, such as population within three miles above 50,000, median household income above $75,000, at most two competitors within two miles and an anchor grocer within 400 meters, and every saved site is judged on each line, with the figure beside the result. Close means within the margin of error. Start from a template for coffee, quick service, salons, fitness, childcare, urgent care or pet, each stating where its thresholds came from, and edit it to the concept. The grid runs over an uploaded list of a thousand candidates and prints on the report with the criteria stated. Included on Pro and Team.
Site comparison stress test
Does the ranking hold when the assumptions move?
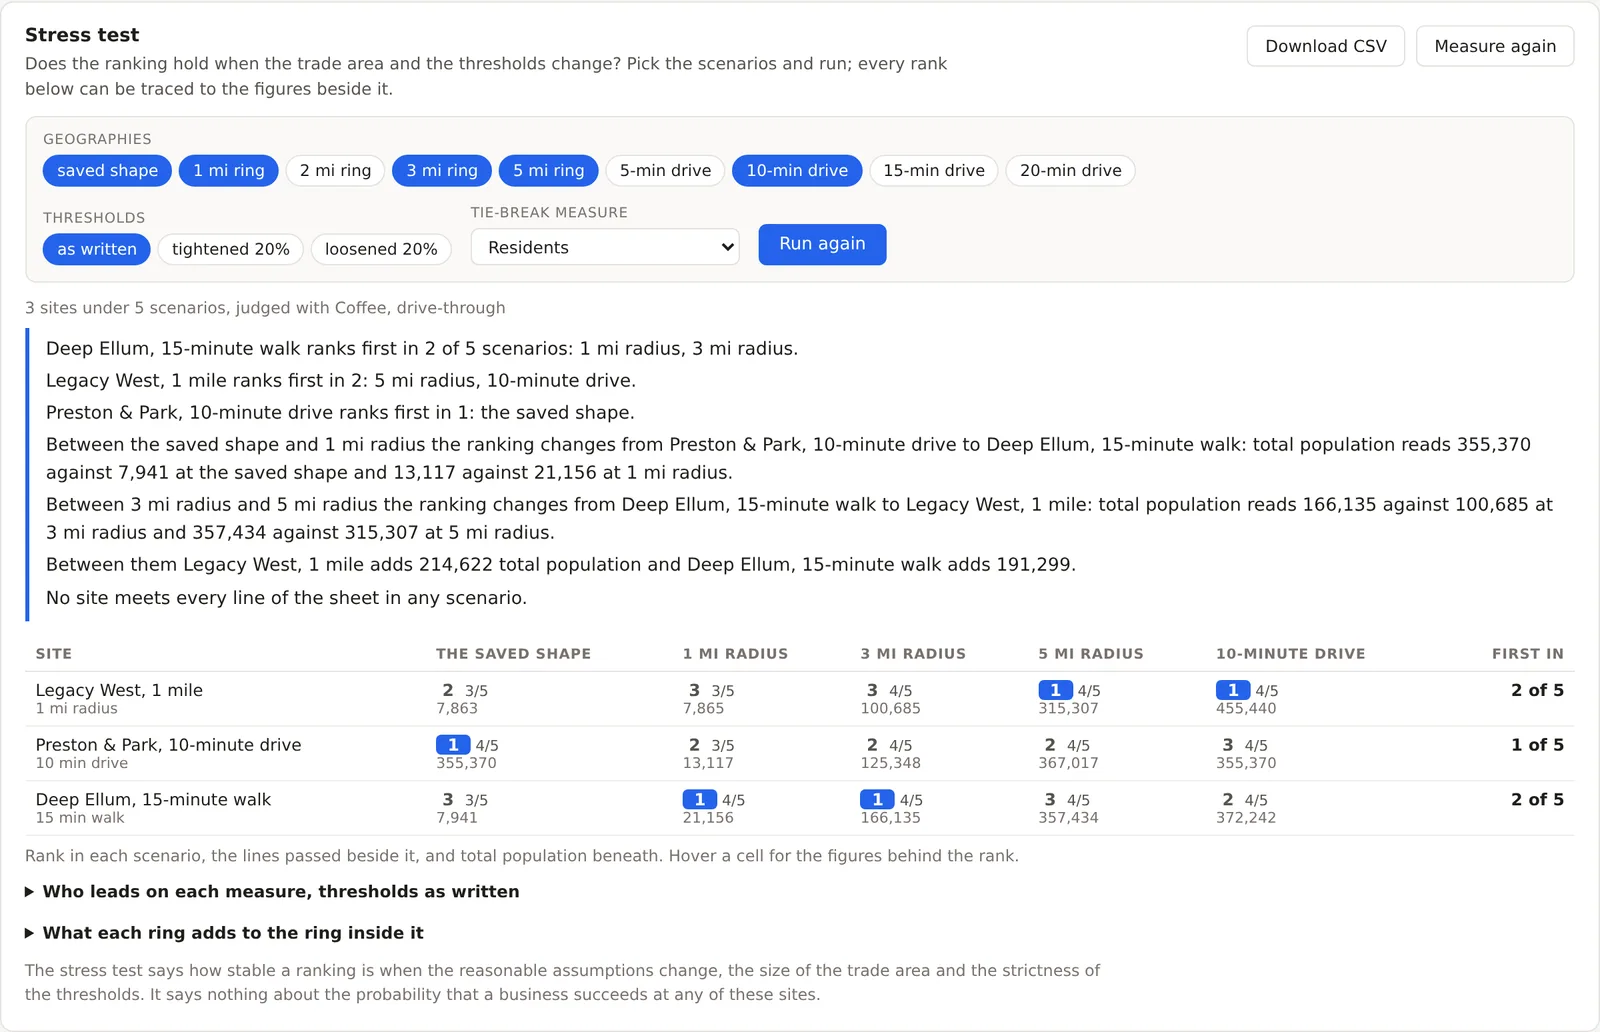
Two candidate sites can swap places between a one-mile ring and a five-mile ring, or between a radius and a ten-minute drive, because one sits on an arterial grid and the other in a college town. The stress test ranks every site under each scenario you choose, with the client's thresholds as written, tightened and loosened, and then explains the result in sentences, where the ranking flips, which measure moved it, what the ground between two rings adds to each site, and which site meets every line most often. It is a statement about stability under assumptions, never about the odds of success. Included on Pro and Team.
Decision history
Keep a record of what was chosen and why
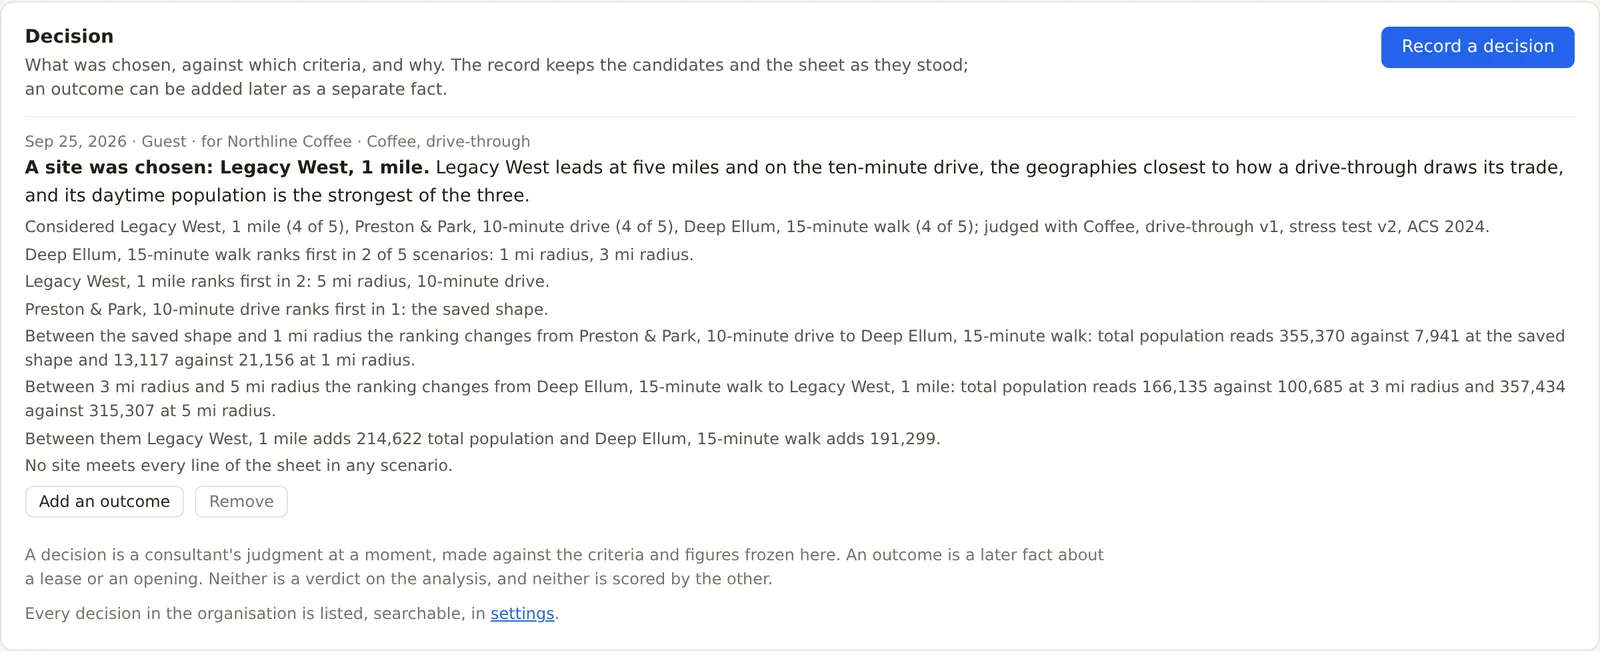
Record on a project which site was chosen, or that none was, along with the client, the concept and the reason. The record freezes what was on the table at the time, namely the candidates, how many lines of the criteria sheet each one passed, the sheet as it was worded and the findings of the stress test, so it still reads correctly long after the project has moved on. Add what happened later, such as a lease signed, an opening, a loss in negotiation or a withdrawal. A decision and an outcome are kept apart, because a strong site can still lose a negotiation, and neither is treated as a verdict on the analysis. The whole history is searchable by client, concept, reason, site and project, and exports as CSV. Included on Pro and Team.
The assistant
Ask the assistant, and let it act when you confirm
Ask the assistant to find a place, draw an area or compare saved sites, and it uses the same analysis tools as the map and explains the results in plain language. When the answer calls for something saved, it proposes a location or a project and shows you the proposal, and nothing is created until you confirm it. Ask it to draft the report narrative and it writes from the figures it retrieved and nothing else, with every number checked against them before you see the draft. Free includes 10 questions a month. Pro includes 300, and Team includes 300 per seat with an additional deep analysis mode.
- Looks up places from a city, county, landmark, business or street address
- Draws and analyzes areas as a radius or a drive, walk, bike or transit time
- Proposes a saved location or project that is created only when you confirm
- Drafts the narrative from the figures it retrieved, for you to accept before it prints
Report narrative
Open the report with prose written from its own figures
Press Generate from data and a draft of a few paragraphs is written from the project's own figures, the same summary the tabs show plus the trend, the places roll-up, the screener grid and the stress test's sentences, under instructions that forbid any number not in that input. Before you see it, every number in the draft is matched against the figures within the rounding written, and a sentence with an unmatched number is removed and counted. Nothing prints until you have read the draft, edited it and saved it, and the report says who did and which data release it was written against. Included on Pro and Team.
The PDF report
Print the whole analysis with your name on it
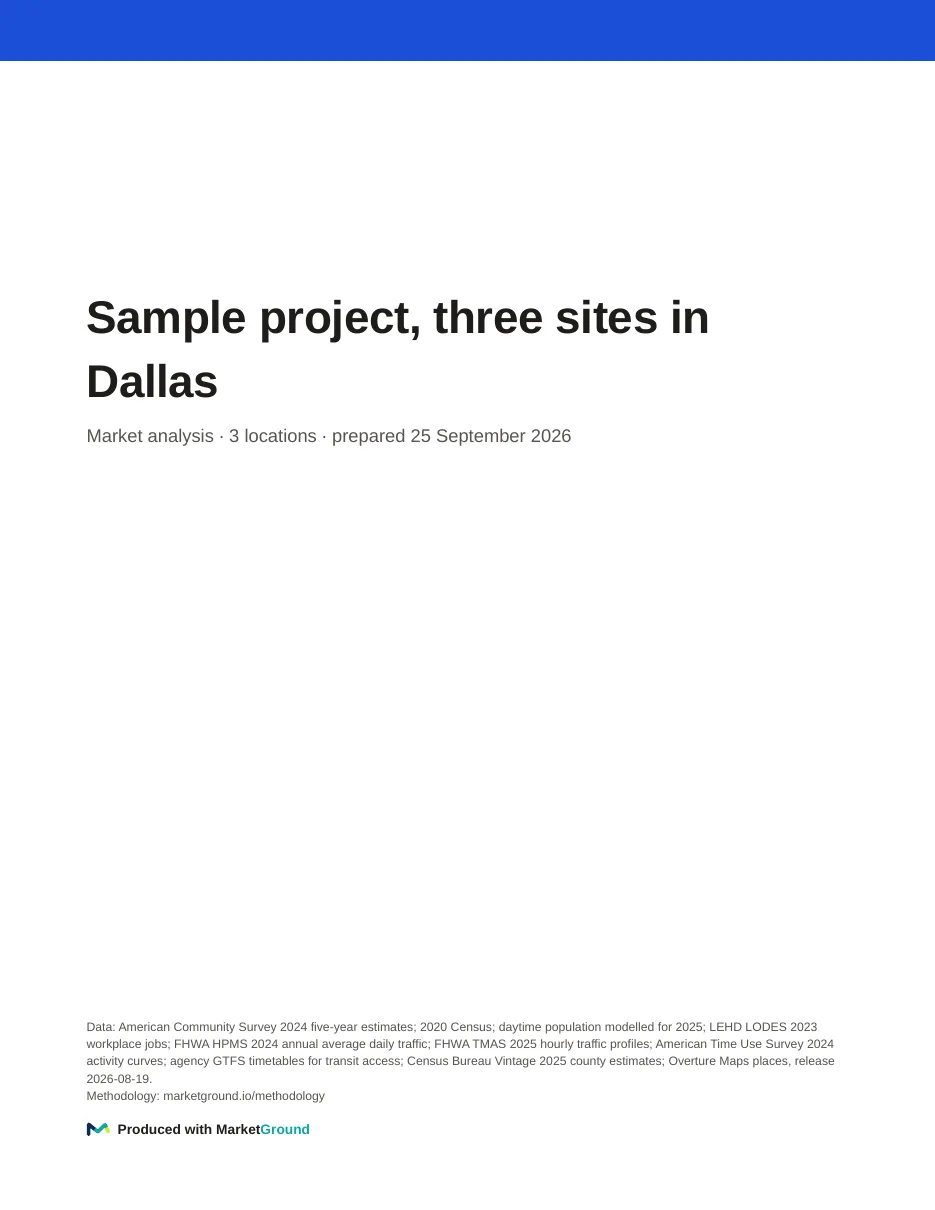
Download the project as a PDF that mirrors the analysis tabs part by part, from the map and the combined figures through people, income and housing, work and movement, businesses, competition and the comparison, with the criteria grid, the stress test and the decision where they exist. Your logo and contact block sit on the cover and every page names its sources and the data release. The report for the Dallas sample project runs to 32 pages. Included on Pro and Team.
Shareable reports
Send a report to a client who has no account
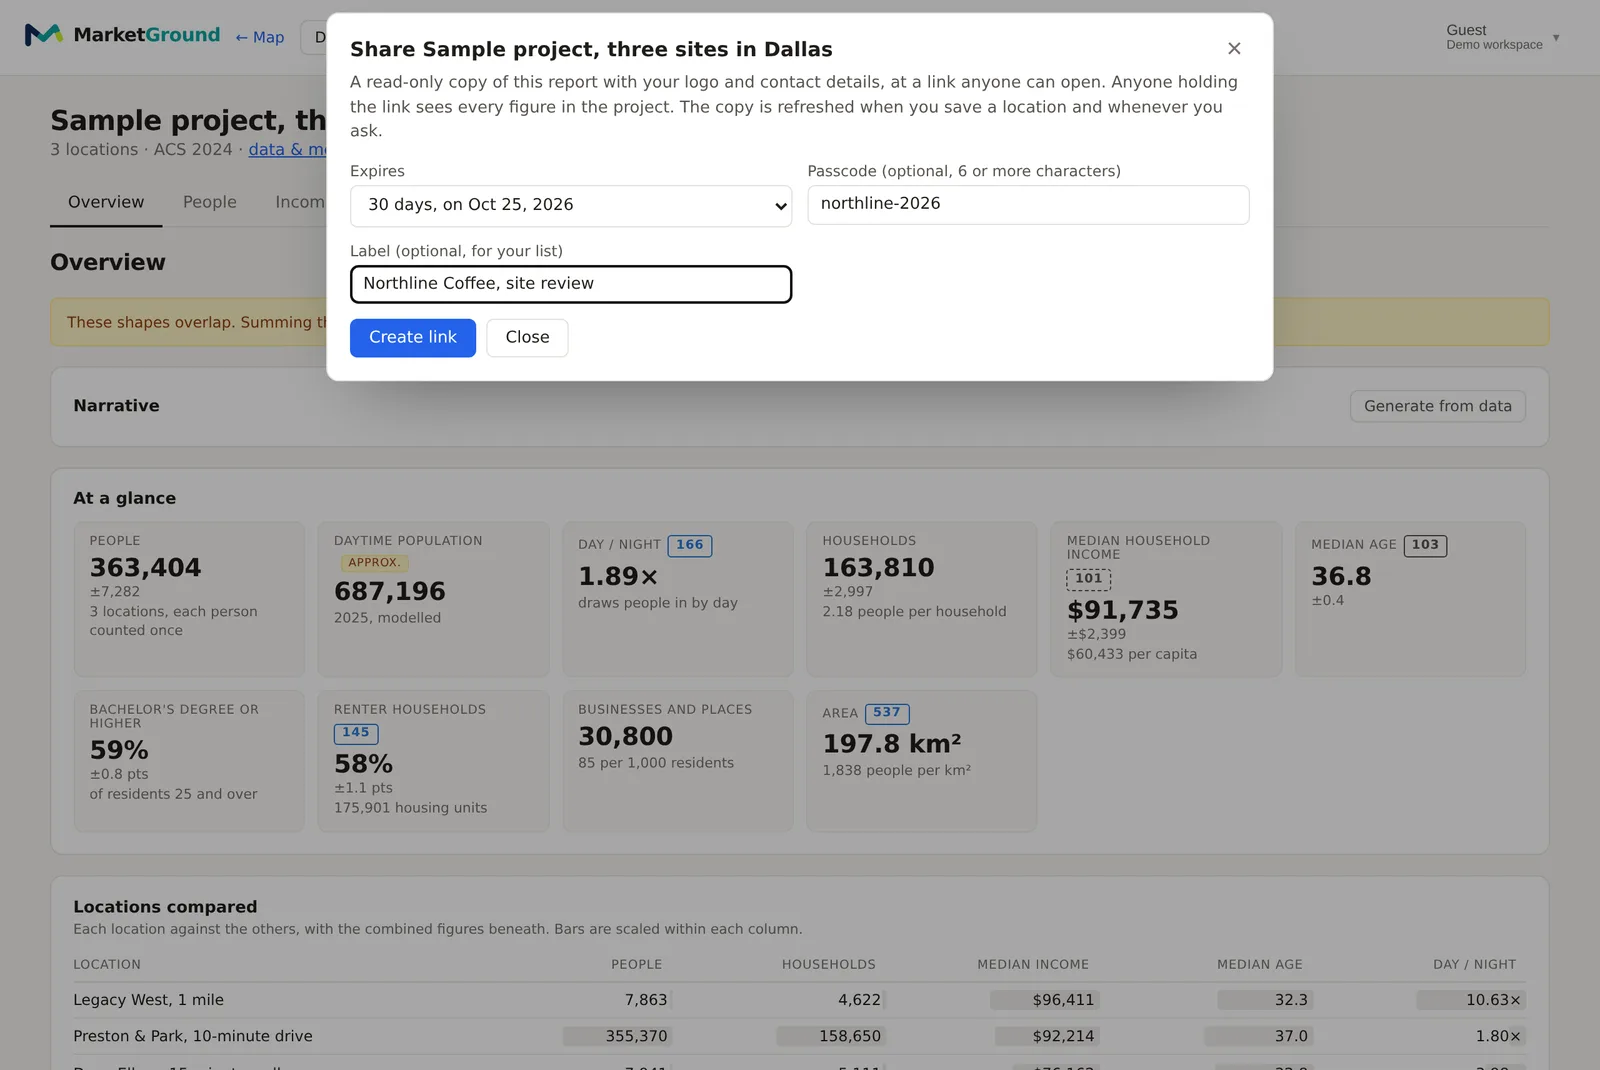
Create a read-only link to a project report carrying your logo and contact details, and send it to anyone. Choose whether it lasts a week, a month, a quarter or a year, add a passcode that you pass on separately, and label the link so you know later who received it. The shared copy refreshes when you save a location, it leaves out the criteria sheet, which stays your own working tool, and you can revoke it at any time. Included on Pro and Team.
Keep reading
The features beside these
Every feature is listed by plan on the features page, and how each figure is built is on the methodology page.