Features / Economy
How much money is here, and how the area is moving
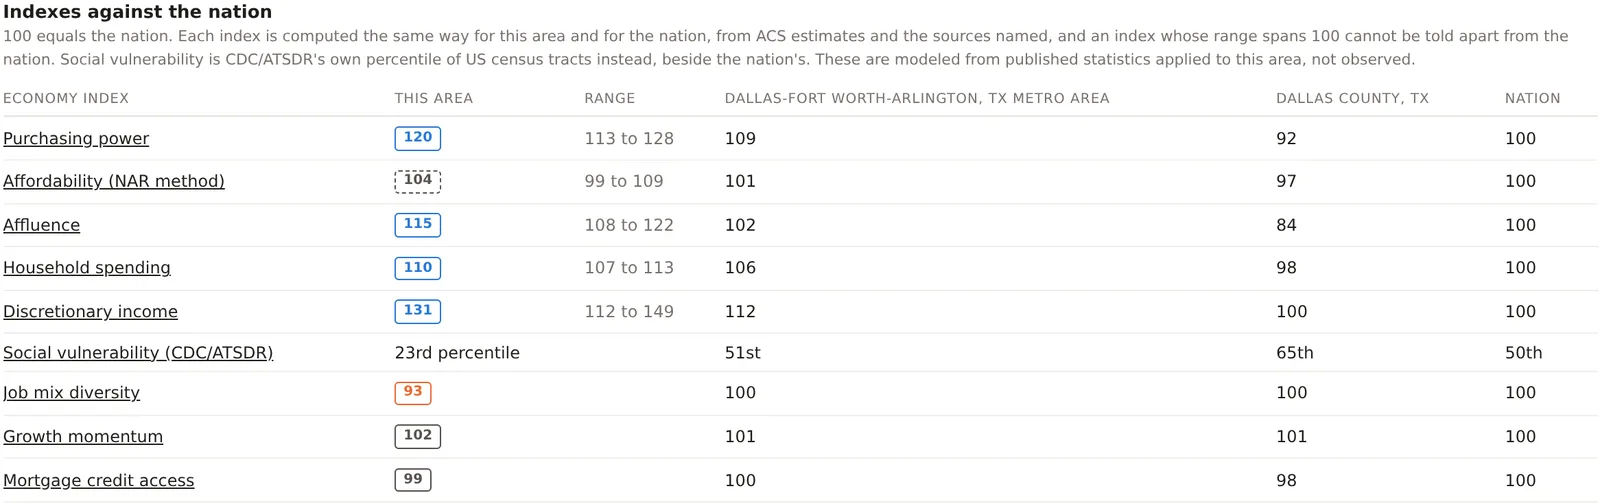
Eight indexes and CDC's social vulnerability percentile answer the questions a lender, a landlord or a retailer asks before committing to a place. Each is computed the same way for your area and for the nation, set beside the metro and the county, and built from public statistics that are named under every card.
Indexes against the nation
Read the local economy in one table
Open the Economy tab on any analysis and every index sits in one table with the nation at 100. Purchasing power sets median household income against the local price level from the Bureau of Economic Analysis. Affordability follows the National Association of Realtors' method for owning and adds rent. Affluence stands in for wealth with home values, investment income and the share of households earning $200,000 or more. Household spending and discretionary income come from the Consumer Expenditure Survey and tax law for each state. Job mix diversity measures how evenly local jobs spread across industries, growth momentum compares yearly growth with the nation's, and mortgage credit access reads how readily home buyers here are approved. Click an index name to open its parts. Included on Pro and Team.
Spending potential
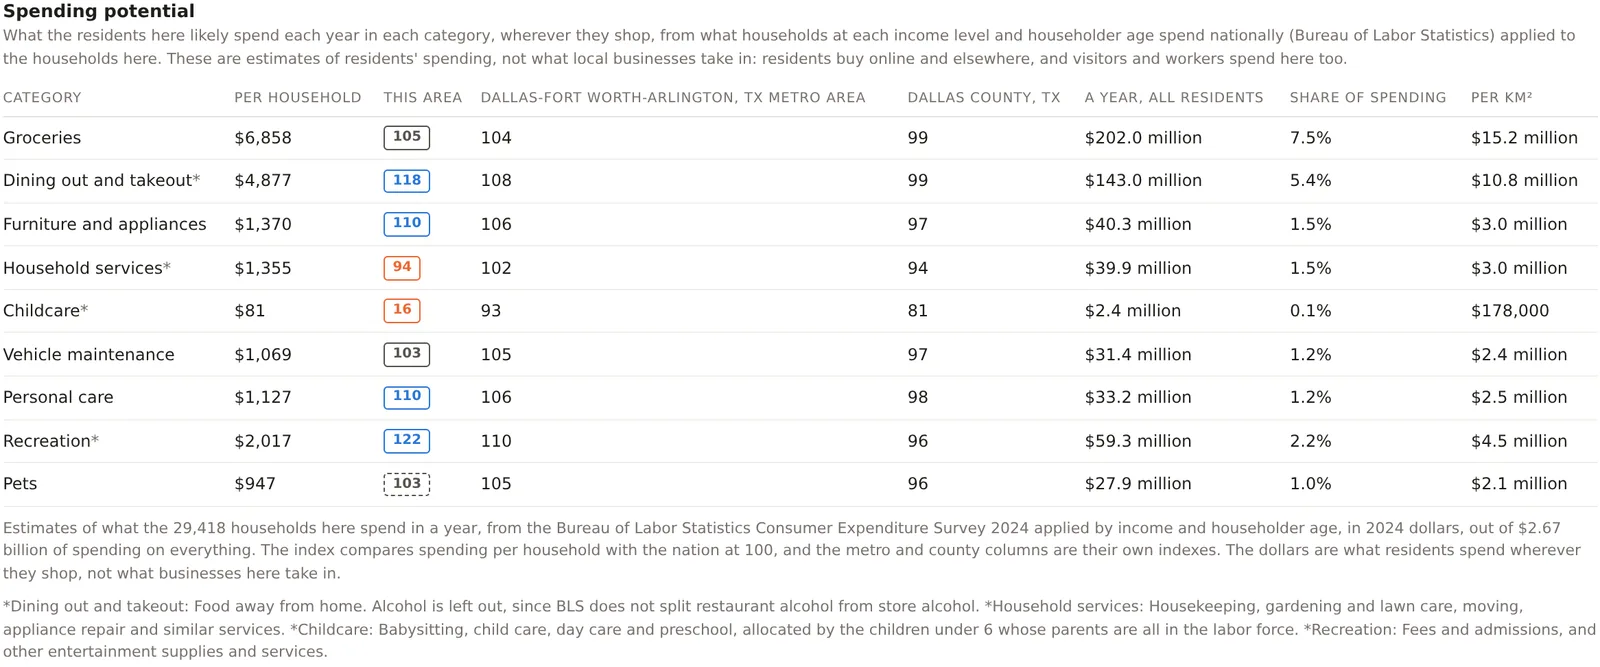
See what residents spend, category by category
Nine retail and service categories, groceries, dining out, furniture and appliances, household services, child care, vehicle maintenance, personal care, recreation and pets, each in dollars per household, as a yearly total for every resident, as a share of all spending and per square kilometer. The model applies what households at each income and householder age spend nationally to the households in your area, and each category is calibrated so that the nation's total matches the Bureau of Labor Statistics' own. Use it to size a market for a category before you count the competitors already serving it. Included on Pro and Team.
Discretionary income
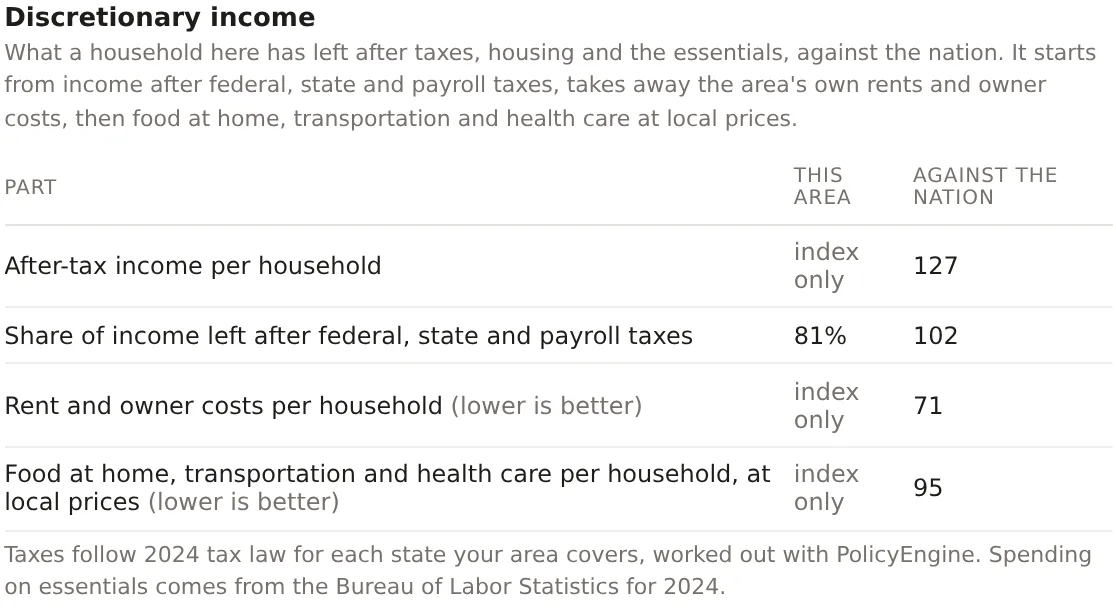
Know what a household has left to spend
Income alone flatters an expensive place. Discretionary income starts from what households keep after federal, state and payroll taxes, worked out under each state's tax law, then takes away the area's own rents and owner costs and the cost of food at home, transportation and health care at local prices. What remains is what a household can spend on everything else, indexed against the nation, with every step shown beside it. Included on Pro and Team.
Growth momentum and home prices
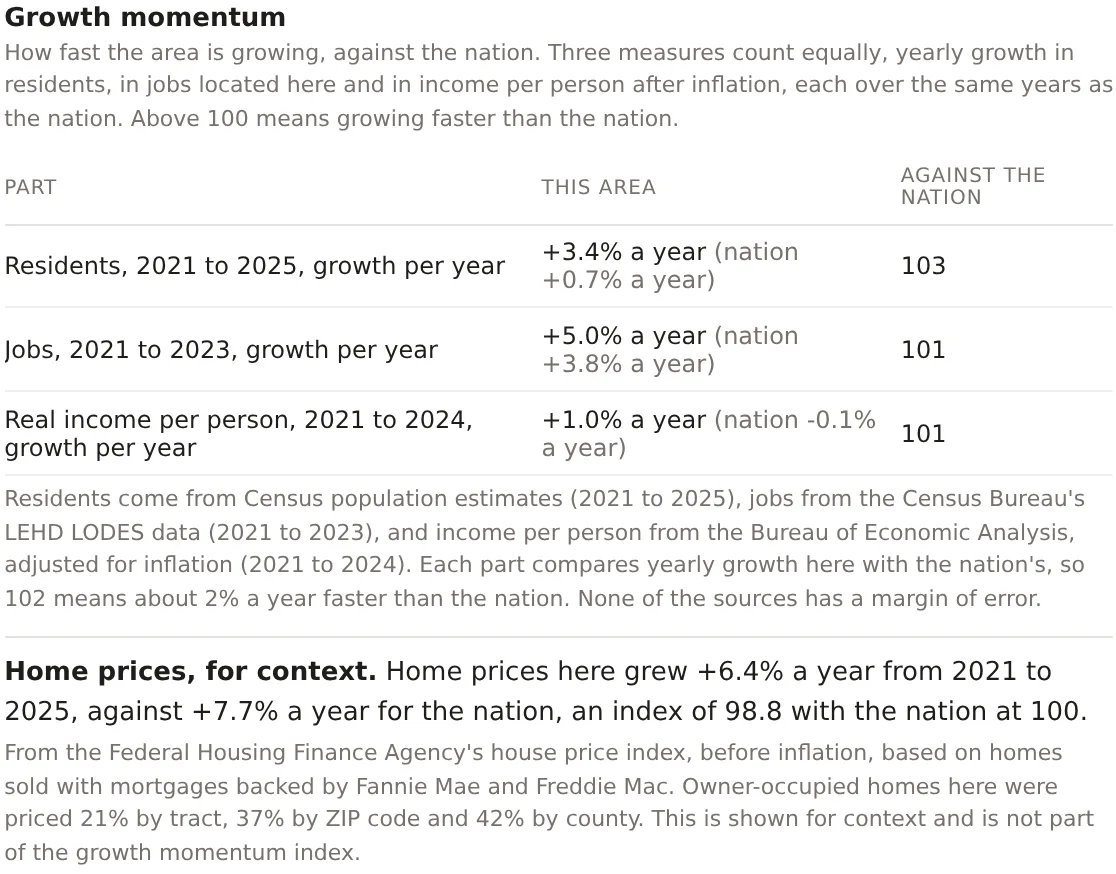
Tell a growing place from a large one
Growth momentum weighs three measures equally, yearly growth in residents, in jobs located in the area and in income per person after inflation, each over the same years as the nation. Above 100 means the area is growing faster than the country. Home price growth from the Federal Housing Finance Agency sits beneath it for context, with the share of homes priced by tract, ZIP code and county, so you can see how closely the figure fits your area. Included on Pro and Team.
Mortgage credit access
See how readily home buyers here are approved
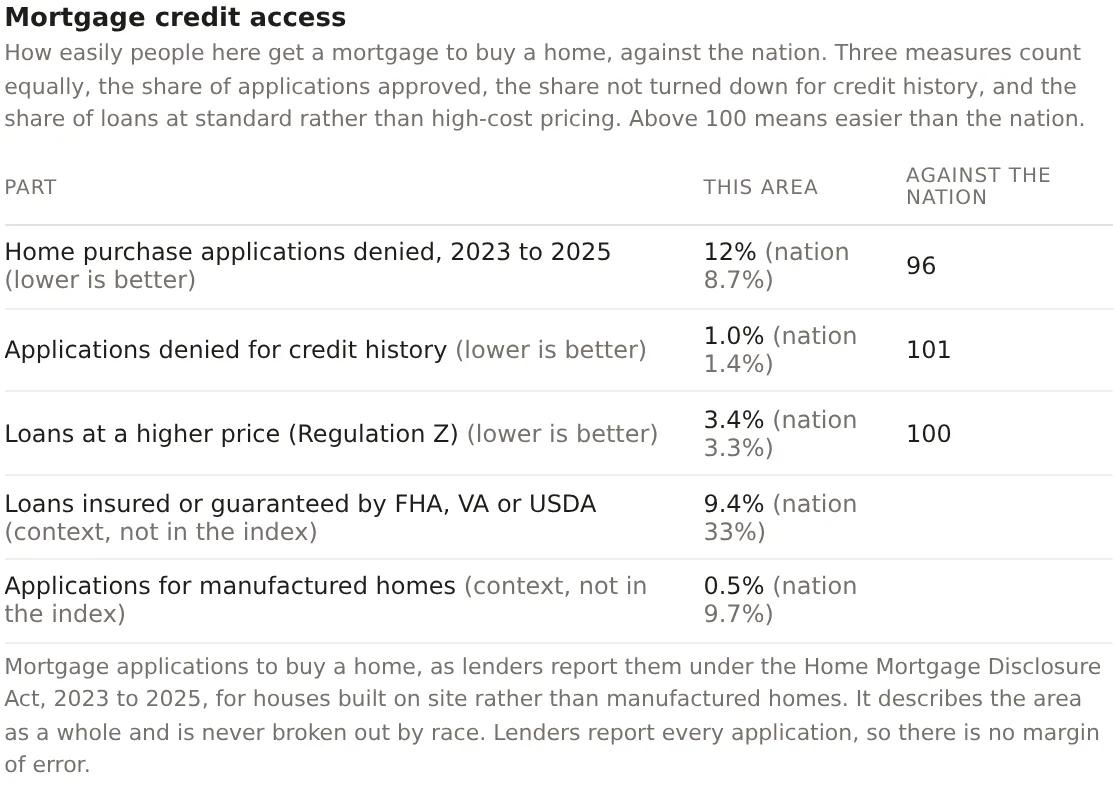
Every home purchase application lenders report under the Home Mortgage Disclosure Act is pooled over three years for the tracts your area covers. The index weighs the share approved, the share not turned down for credit history and the share of loans at standard rather than high-cost pricing. Government-backed loans and manufactured homes are shown beside it for context. It describes the area as a whole and is never broken out by race. Included on Pro and Team.
Tract designations
Know which programs cover the people here
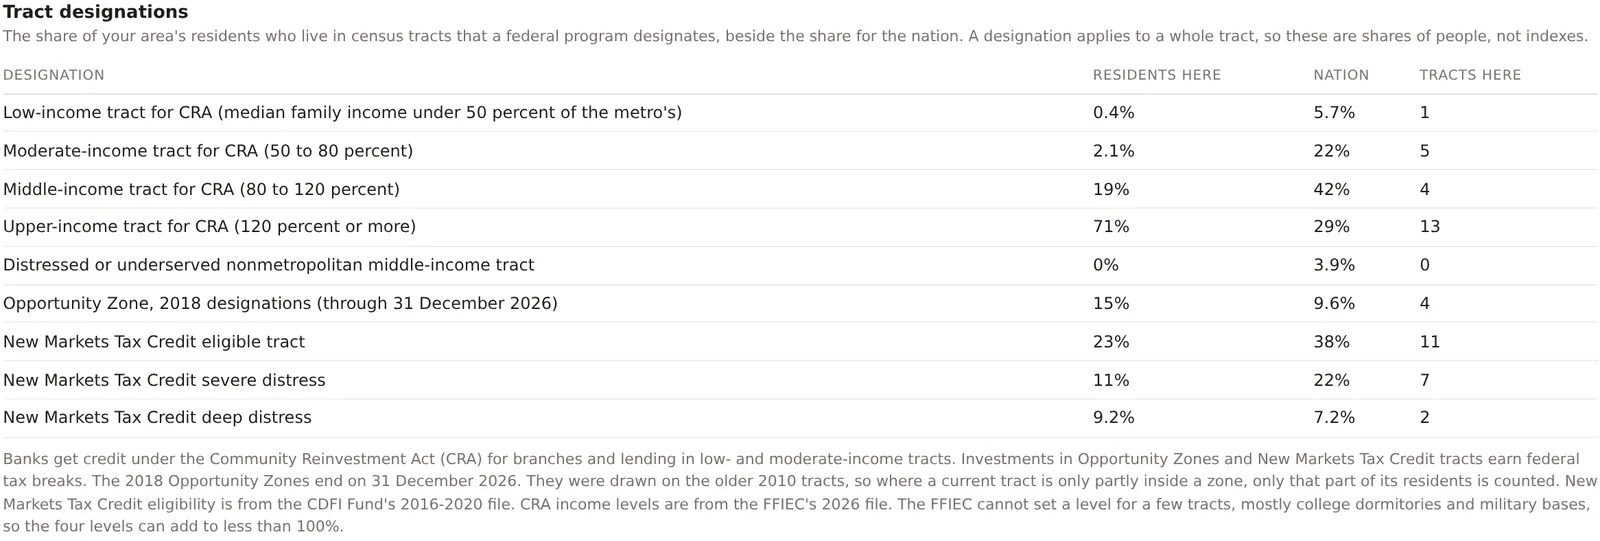
See the share of your area's residents who live in tracts each federal program designates, beside the nation's share. Community Reinvestment Act income levels come from the FFIEC's file for the year, and a branch or a loan in a low- or moderate-income tract counts toward a bank's CRA record. Opportunity Zones and New Markets Tax Credit eligible tracts carry federal tax incentives for investment, with the CDFI Fund's severe and deep distress tiers shown alongside. Included on Pro and Team.
Banking
Count the branches, the deposits and who holds them
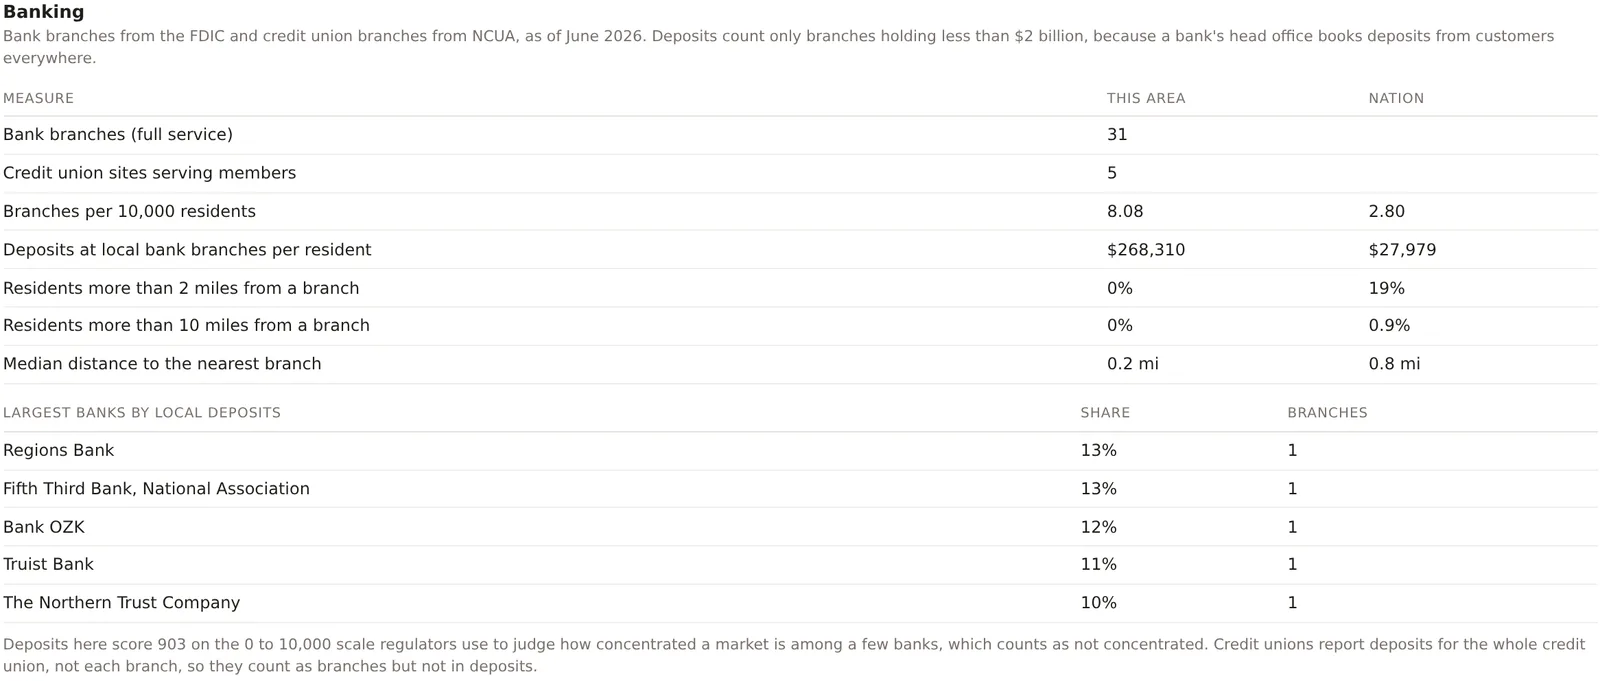
Every bank branch in the FDIC's Summary of Deposits and every credit union site from NCUA inside your area, with branches per 10,000 residents, deposits booked at local branches per resident, the share of residents more than 2 and 10 miles from a branch, and the banks holding the most local deposits. The card scores how concentrated those deposits are on the scale regulators use, and leaves out the head offices that book deposits from customers everywhere so the figures describe the branches people actually use. Included on Pro and Team.
Keep reading
The features beside these
Every feature is listed by plan on the features page, and how each figure is built is on the methodology page.
Day and night population, jobs by industry, combined demographic tables, population history, benchmarks and margins of error.
Traffic counts through the week, when the area is busy, transit access, the Retail map layer, businesses by category and brand, openings and county momentum.