Trade area analysis
Understand the market within your trade area
Define an area around a location and explore its population, demographics, daytime activity and nearby businesses. MarketGround supports a radius, rings, travel areas, custom boundaries and named geographic areas.
Every state and the District of Columbia. No data license to buy and no consultant to book.
The decision
Assess whether a location fits your customers
A trade area describes the surrounding market you want to evaluate. Its size and shape should reflect how customers could reach the location. Use the analysis to compare the number and characteristics of nearby residents with the businesses already operating there. Combine those findings with your knowledge of the site and business.
A real example
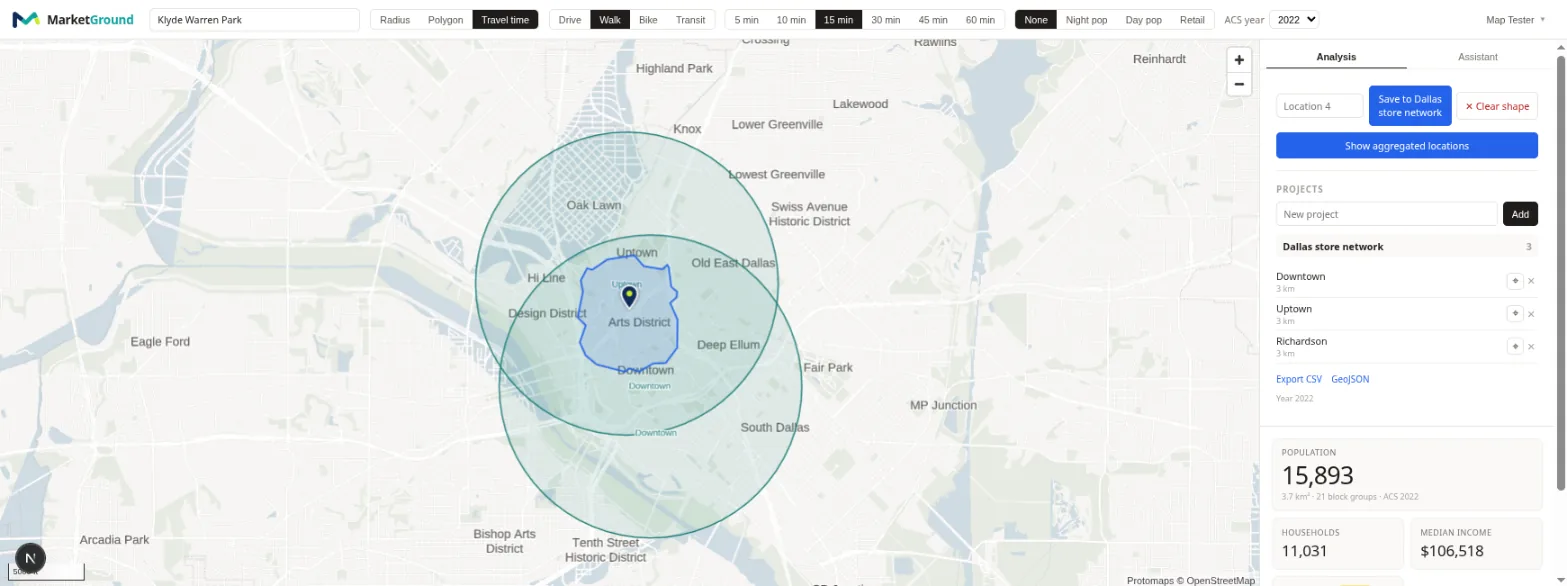
Fifteen minutes on foot from Klyde Warren Park in Dallas.
The blue outline below is everywhere a person can walk to in fifteen minutes from the pin in the park. It hugs the street grid, reaches along the walkable corridors and stops at the highway, which is exactly what a circle of the same size would get wrong. Inside it live 13,319 people in 9,284 households across 3.0 square kilometers, with a median household income of $119,819. The teal outline to the east is a walking area saved earlier in the same project.
Reading the answer
Compare local measures with the wider market
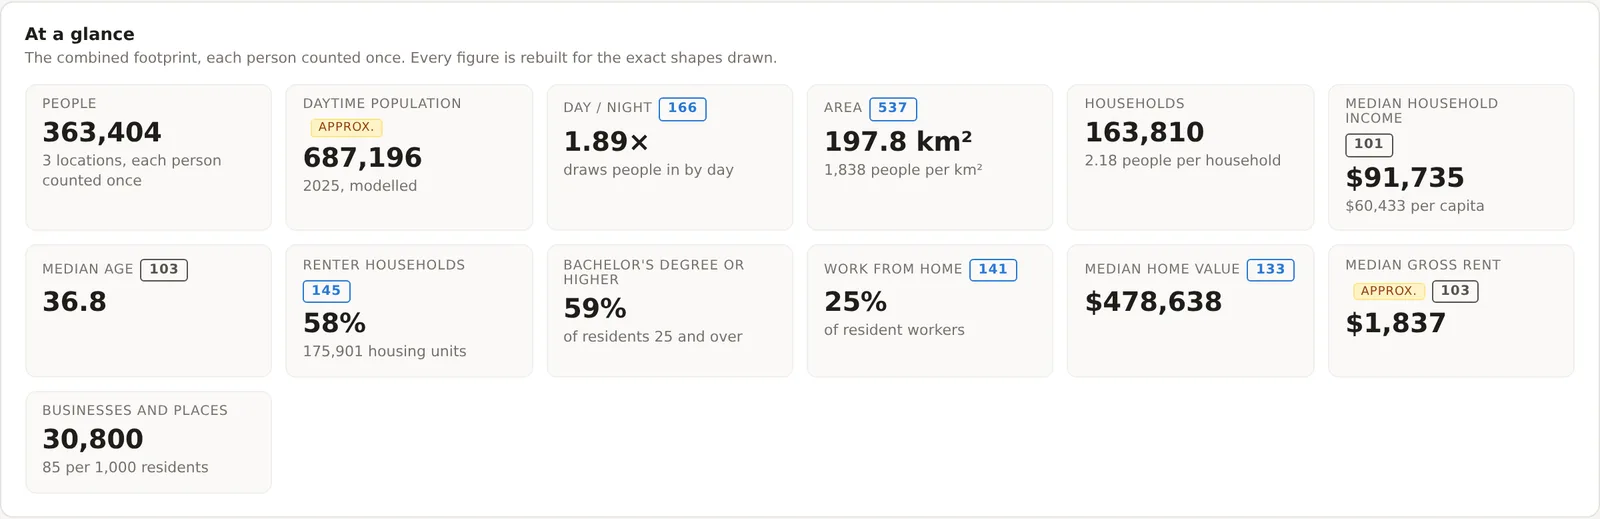
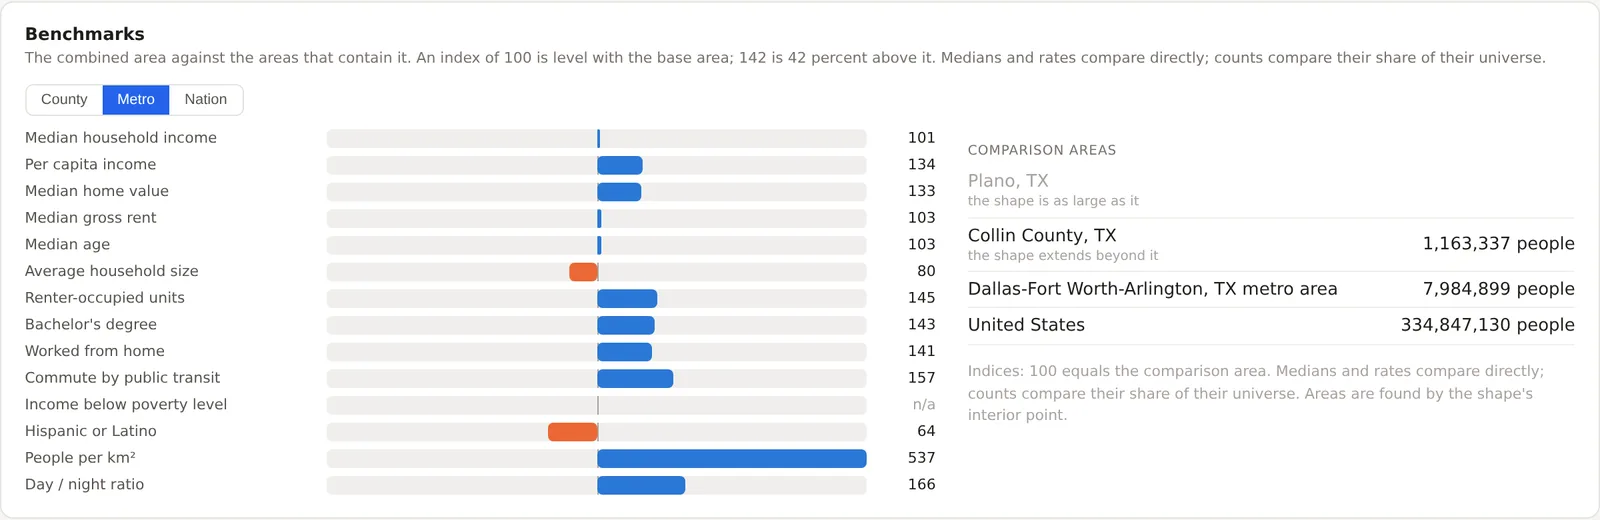
Benchmarks help you interpret a result in context. An income index of 101 means median household income is 1 percent above the comparison area. A renter index of 145 means the renter share is 45 percent higher. Choose a city, county, metro area or national benchmark to understand how your selected area differs.
What you can draw
Choose the boundary that suits the question
Use a radius or rings for consistent distance comparisons. Choose a travel area when road access or journey time matters. Draw a custom polygon to follow a service boundary or other area of interest. You can also select a ZIP area, city, county, metro area or census tract directly.
What arrives with the shape
Everything for one outline, in one pass.
The people
Explore population, households and 250 demographic measures covering income, age, housing, education, commuting and other characteristics. Combined Census tables let you examine measures such as age and sex together for your selected area.
The day and the night
Review resident and daytime population estimates, their ratio and population history for each area. Jobs by industry provide context about the workplaces within it.
The competition
Every listed business and place inside the outline, counted by category and by brand, from open map data refreshed every month. Potential competitors and the businesses that draw similar customers appear in the same table.
What it costs
Free to start, and the paid plans are flat monthly prices.
| What you get | Free | Pro | Team |
|---|---|---|---|
| Radius and polygon areas | Yes | Yes | Yes |
| Travel areas | No | Up to 60 minutes | No cap |
| Rings and named boundaries | No | Yes | Yes |
| Demographic measures | 33 | 250 | 250 |
| Benchmarks and index scores | No | Yes | Yes |
| Export and PDF report | No | Yes | Yes |
Swipe the table sideways to see every column.
Pro is $79 a month for one seat and Team is $59 per seat a month for five seats or more. The full comparison is on the pricing page.
Questions
Questions people ask
What is a trade area?
A trade area is the geographic market from which a business draws, or expects to draw, customers. Its extent depends on the business and how people travel. MarketGround helps you evaluate possible trade areas using distance, travel time or a boundary you define.
Should I use a radius or a drive time?
Use a radius when you want a simple, comparable footprint, such as one mile around every candidate site. Use a driving area when road access is the thing that decides, because a ten-minute drive from a site beside a highway covers far more ground than the same ten minutes downtown. Many people review both, since a radius compares consistently across sites and a driving area describes access.
How accurate are the numbers?
MarketGround combines Census population and demographic data for your selected area. Counts are allocated geographically and medians are reconstructed from their underlying distributions. The methodology page explains the calculations and validation checks.
Can I analyze a ZIP code, a city or a county instead of drawing?
Yes. Select a ZIP area, city, county, metro area or census tract from the map or search box. Counties and tracts are assembled from their component block groups. Other boundaries may require allocation, and the methodology explains where results can differ from directly published figures.
Does it cover the whole country?
Population, demographics, day and night population, jobs and business listings cover all fifty states and the District of Columbia. Travel areas are computed on the national road network, and public transit is available in the metro areas whose timetables we hold.
Can I get the numbers out?
Paid plans export any project as CSV for a spreadsheet or GeoJSON for your own maps, and render a PDF report carrying your logo, your contact block and your accent color. The free plan is for drawing and reading on screen.
Keep reading
Explore the methods and related guides
Read the methodology for sources and calculations, explore the features page or follow the getting started guide. The research section includes studies and practical examples of location analysis.
Compare candidate stores using nearby households, daytime population and listed businesses.
Compare proposed franchise territories using consistent areas and a report you can share.
Compare residents, daytime population and restaurants around potential locations.
Add population, employment, income and travel access information to property analysis.
Compare estimated daytime population with residents for the area you choose.
Explore a familiar location
Draw an area around a site you know and review its population, demographics and businesses. Use the comparison to understand what the data adds to your existing knowledge.