Features / Competition
Count the competition and read the market it leaves
Who is already serving the area, how much of the nearby population each store can reach by travel time, where your own sites take from each other, which brands usually sit beside a concept, and where a chain has stores and where it does not. Every number carries its assumptions.
Competitors and market share
Count the competitors and estimate the share they leave
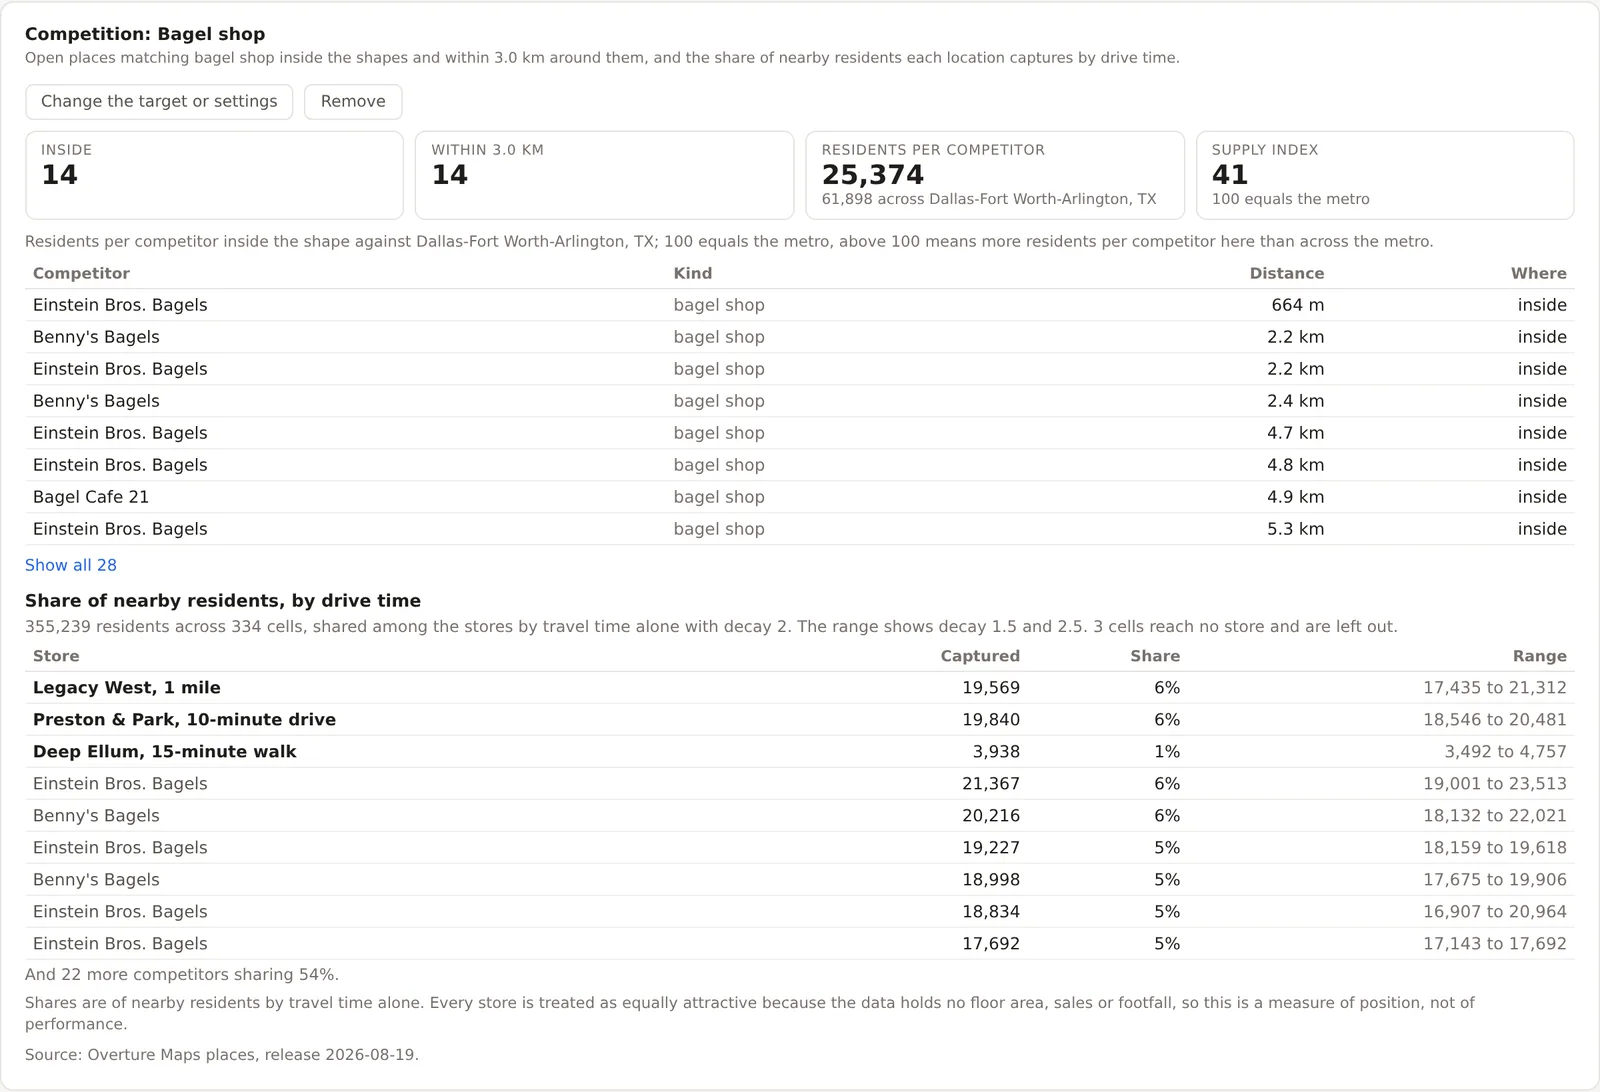
Choose the kind of business you compete with, either a category from the listings with everything under it or a brand matched exactly as listed. MarketGround counts the open places inside the area and within a ring around it, divides the residents by the competitors inside, and indexes that against the same figure across the metro, where 100 equals the metro. A Huff gravity model then shares the nearby residents among the stores in proportion to travel time on the road network, with the decay shown at three settings so the range is visible. The share is of nearby residents, by travel time alone, and every store is treated as equally attractive, so the result is a measure of position rather than performance, and the card says so beside the number. Included on Pro and Team.
Cannibalization
See where your own sites compete with each other
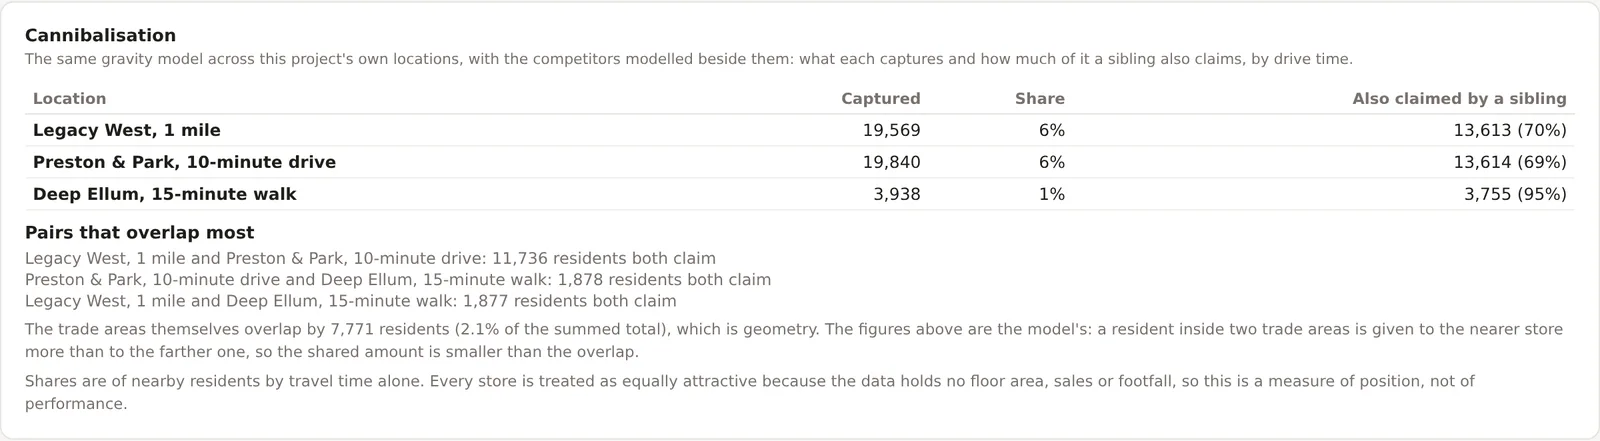
Run the same gravity model across the locations in your own project, with the competitors modeled beside them, and the Compare tab reports what each site captures and how much of it a sibling also claims. The pairs that overlap most are named with the residents both claim, next to the plain geometric overlap of their trade areas, so you can see that a resident inside two trade areas is given more to the nearer store than to the farther one. Read it as the model's view of position, by travel time alone, never as sales moved from one store to another. Included on Pro and Team.
Co-tenancy as a brand
Match a site against the neighbors a brand usually has
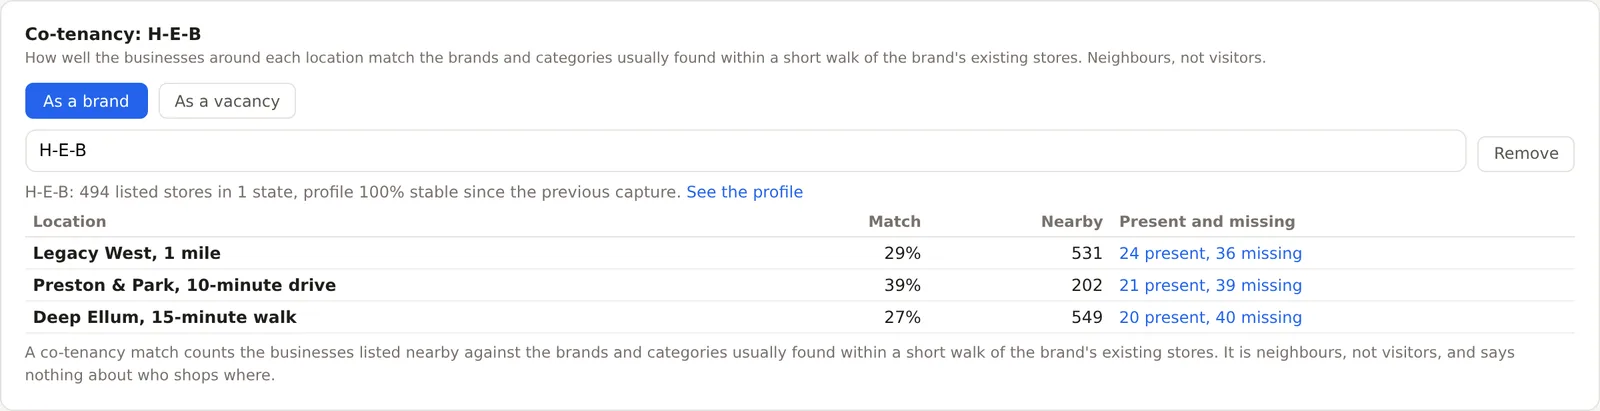
For every brand with at least twenty listed stores, MarketGround builds a profile of the brands and categories usually found within 400 meters of its existing stores, a five-minute walk. Pick the brand and each saved location is scored on how much of that profile is already present around it, with the neighbors present and missing one click away so the number can be checked. Open the profile to read every usual neighbor with its share and its lift over branded stores in general. It is neighbors, not visitors, and it says only that the businesses a brand usually sits beside are already there. Included on Pro and Team.
Co-tenancy as a vacancy
Find the brands that fit a vacancy
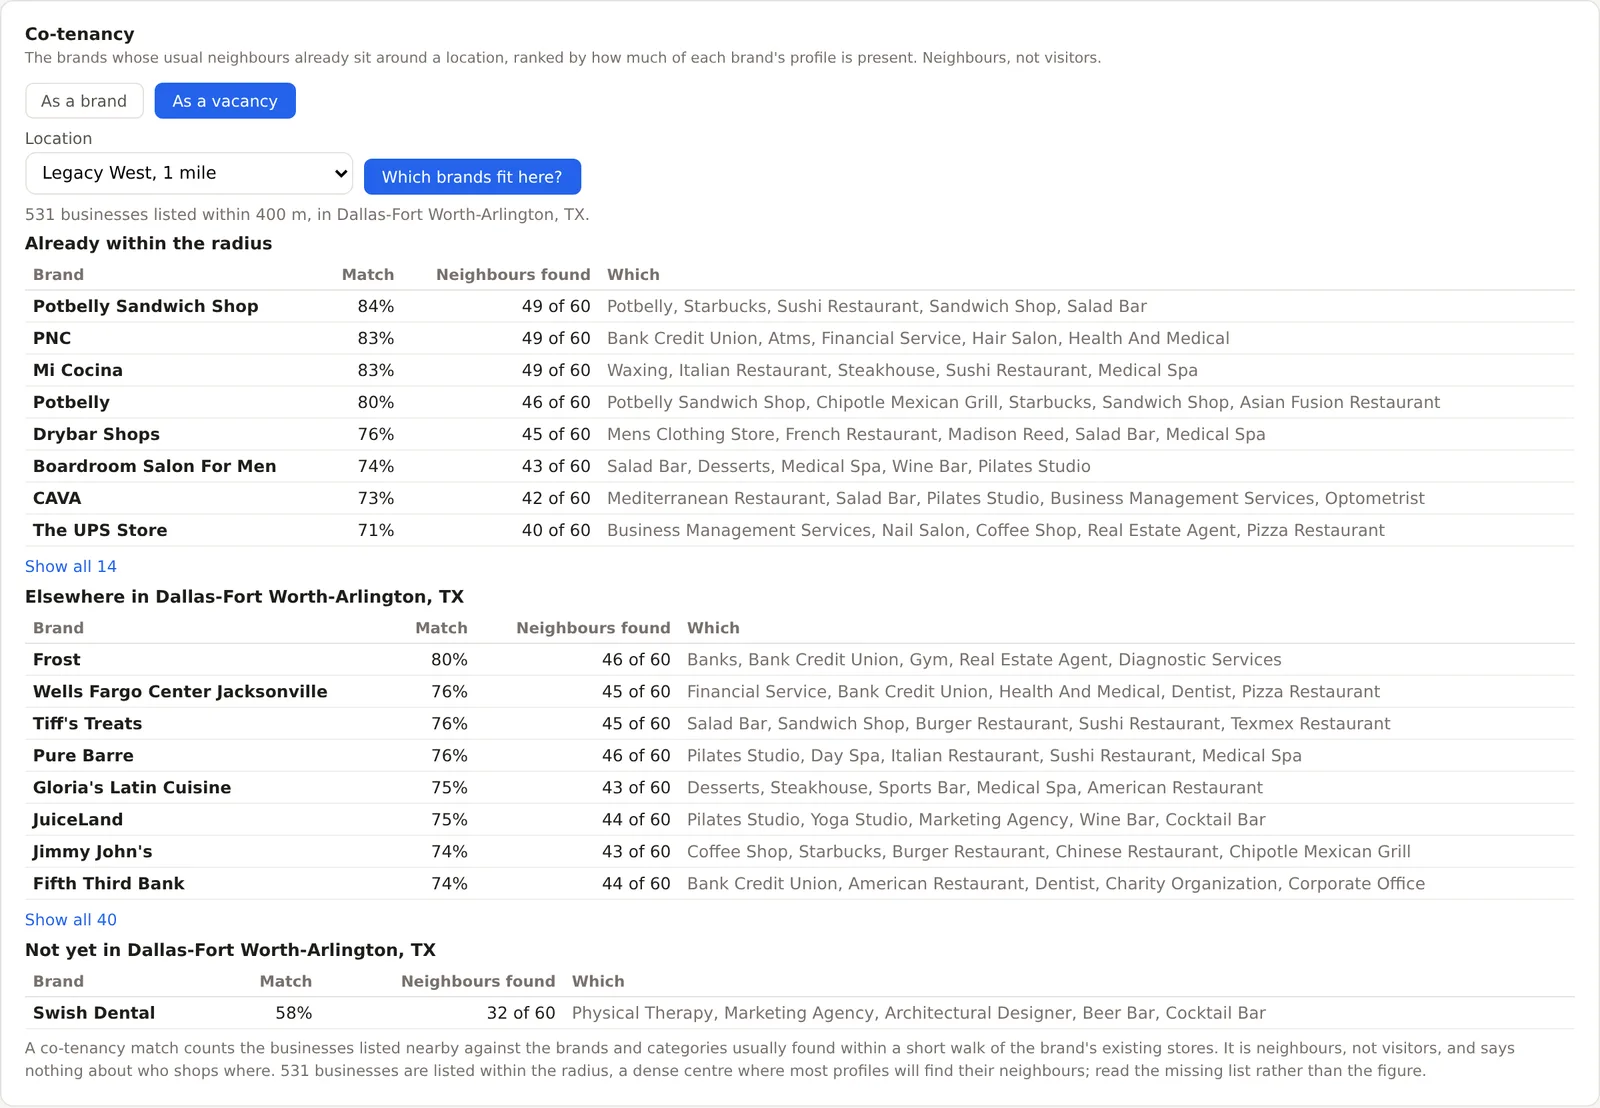
Turn the question around for an empty unit. Choose a location and MarketGround scores every profiled brand against the businesses already within 400 meters, then ranks them in three groups, the brands already inside the radius, the brands present elsewhere in the metro, and the brands not yet in the metro at all. Each row names the neighbors it found, so a high match can be read rather than trusted. In a dense center most profiles find their neighbors, and the card tells you to read the missing list rather than the figure. Included on Pro and Team.
Chain footprints
Read where a chain has stores and where it does not
Every brand with twenty or more listed stores has a footprint, its store count by state and by metro with the residents and households of each area per store, and the largest five hundred have a public page under Research, Chain footprints. Each page opens with the whitespace, the metros of 250,000 or more residents with no store listed, because that absence is the question most readers bring. Filter the Retail layer to the brand to see every location on the map, or start a demo from the page to analyze a site for that chain. A footprint is a count of doors, never a measure of how well any store does, and every page says so in its first line. The brand pages need no account.
Keep reading
The features beside these
Every feature is listed by plan on the features page, and how each figure is built is on the methodology page.
Traffic counts through the week, when the area is busy, transit access, the Retail map layer, businesses by category and brand, openings and county momentum.
Projects, the criteria screener, the stress test, decision history, an assistant that acts, the PDF report and shareable links.