Restaurant site selection
Understand the area around your next restaurant
Explore nearby residents, daytime population and existing restaurants. Compare locations using the area your customers could reach on foot or by car, then review the demographic profile around each site.
Every state and the District of Columbia, with restaurant listings refreshed every month.
The decision
Compare the local markets for your concept
An office district and a suburban center may offer different opportunities for the same restaurant. Review resident and daytime populations together, then examine nearby households and competing restaurants. These measures help you frame decisions about the concept, location and service hours.
A real example
Deep Ellum in Dallas against a suburban center in Garland.
One mile around Deep Ellum, on the eastern edge of downtown Dallas, holds 20,150 residents and 142,191 people during the working day, seven times as many. Three miles around Firewheel Town Center in Garland holds 99,529 residents and 70,559 people by day, about seven in ten. Five times the residents, half the daytime crowd, and two entirely different restaurants.
| Deep Ellum, 1 mile | Firewheel Garland, 3 miles | |
|---|---|---|
| Residents | 20,150 | 99,529 |
| Daytime population | 142,191 | 70,559 |
| Median household income | $80,890 | $96,793 |
| Median age | 33.3 | 38.7 |
| Aged 25 to 44 | 11,868 of 20,150 | 25,559 of 99,529 |
| Renter households | 10,934 of 12,790 | 9,854 of 34,100 |
| Eating and drinking places | 558 | 233 |
Swipe the table sideways to see every column.
The table compares a one-mile area around Deep Ellum with a three-mile area around Firewheel. Sources and data periods are described on the methodology page.
Deep Ellum has a younger population, a high share of renters and 558 listed eating and drinking places within one mile. In Garland, about three quarters of households are families, and the three-mile area has fewer than half as many listed eating and drinking places. The contrast provides useful context when comparing restaurant concepts and locations.
Who is nearby
Explore age and household characteristics
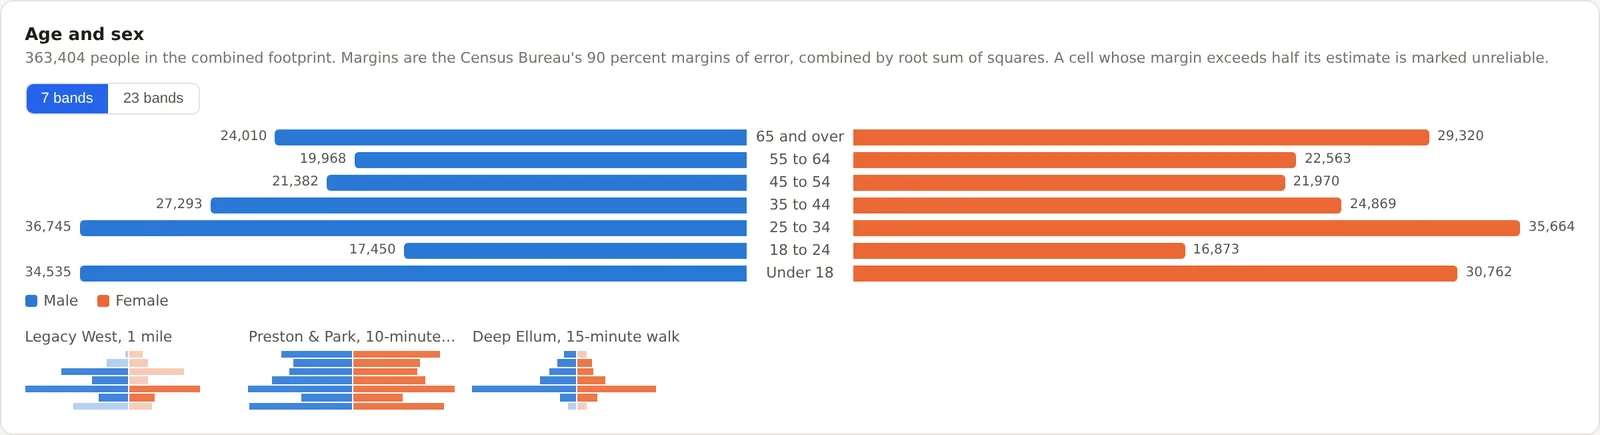
View age and sex together using combined Census tables. Choose seven grouped age bands or all 23 Census bands. Additional tables cover housing tenure and income by age of householder, households with children, and education by sex.
Where the lunch trade is
Explore areas with daytime activity
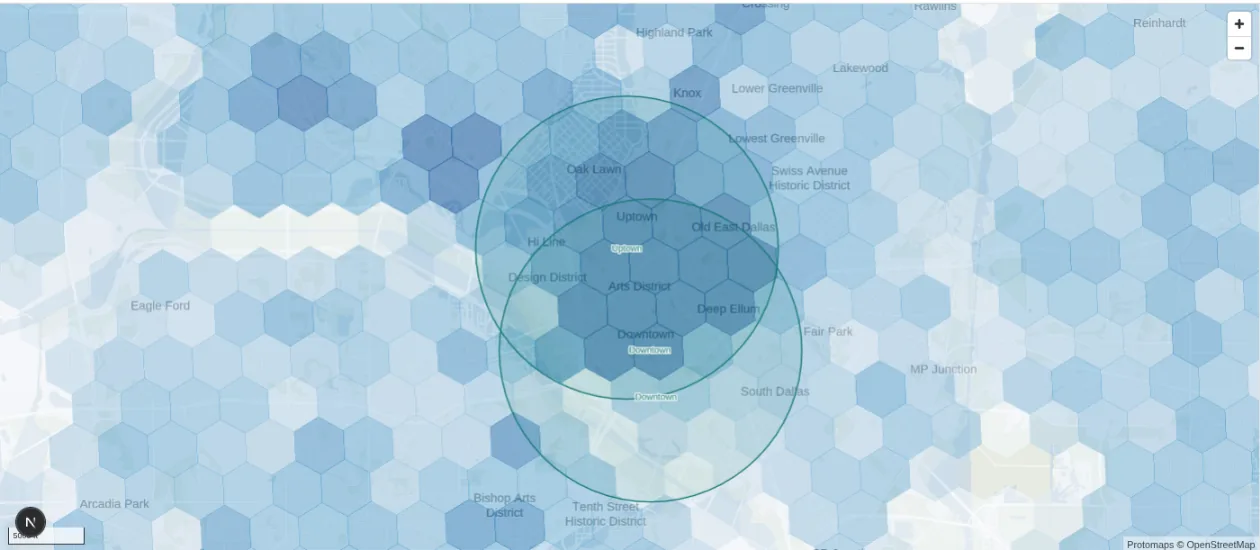
Turn on the daytime population layer to compare activity across a city. Each area you draw includes a daytime estimate, resident population and the ratio between them. Jobs by industry provide further context about the workplaces nearby.
How the daytime figure is builtQuestions
Questions people ask
How big is a restaurant trade area?
Choose an area that reflects your restaurant's format and how customers travel. A walking area may suit a downtown lunch concept, while a suburban restaurant may benefit from a driving area. Compare a few distances or travel times to see how the surrounding market changes.
Should I look at residents or the daytime population?
Review both. The resident population describes the nearby residential market, while the daytime estimate adds context about activity during the working day. MarketGround shows the two measures together so you can compare locations in relation to your concept.
Can I see which ages live nearby?
Yes. MarketGround uses the Census Bureau's combined age and sex tables to estimate the groups within your area. View seven grouped age bands or expand the table to all 23 Census bands.
How many competing restaurants are inside the area?
Every listed place that carries an eating or drinking category is counted, broken down by specific category and by brand. It is a count of locations rather than seats or sales, so treat it as a measure of how crowded the block is, not of how much money is being taken.
Does it cover delivery radii?
You can draw the radius or the drive time your delivery operation actually works to and read the households inside it, which is the same question in a different shape. Order volumes from the delivery platforms are private and are not in the product.
What data is behind it?
MarketGround combines Census population, demographic and employment data with LandScan population information and Overture Maps business listings. The methodology page explains how each source is used.
Case study
A related example
Keep reading
Explore the methods and related guides
Read the methodology for sources and calculations, explore the features page or follow the getting started guide. The research section includes studies and practical examples of location analysis.
Define an area and explore its population, income and listed businesses.
Compare candidate stores using nearby households, daytime population and listed businesses.
Compare proposed franchise territories using consistent areas and a report you can share.
Add population, employment, income and travel access information to property analysis.
Compare estimated daytime population with residents for the area you choose.
Explore a restaurant location you know
Draw an area around a familiar restaurant and review the resident population, daytime estimate and household characteristics. Use what you learn to compare other locations.