Features / Sales forecast
Forecast a candidate's sales from the stores you already run
Your own stores are the best evidence you have about where the next one should go. Upload them with their sales, and MarketGround fits a model to those figures against everything it measures around each store, then scores any candidate corner in your own currency, with a likely range, the drivers behind the number and the error the model made on stores it had never seen.
Fit to your own figures
Start from a spreadsheet you already have
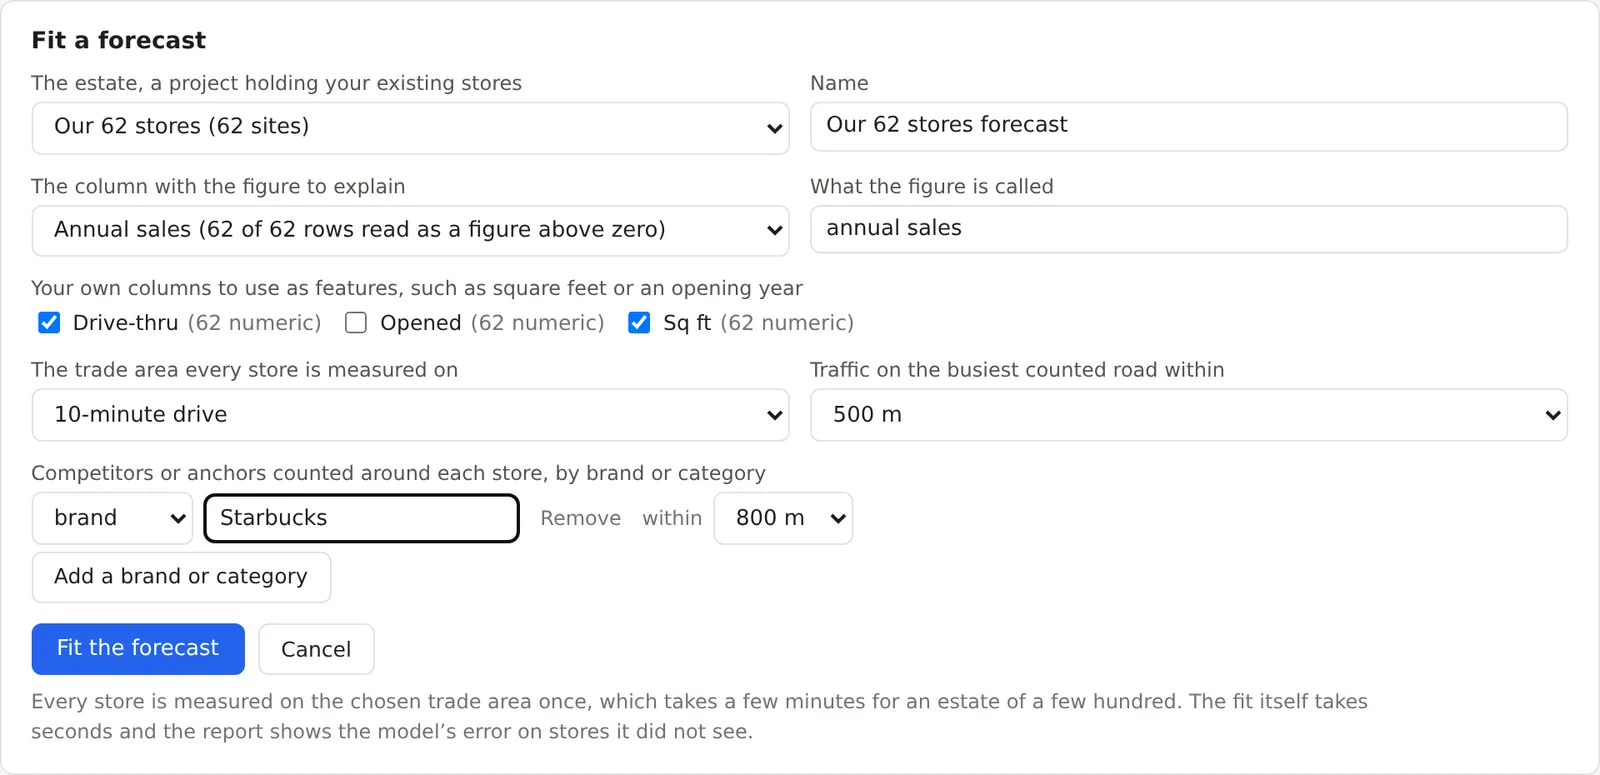
Upload the stores you run as you would any site list, with a sales, visits or enrollment column beside each address and any other columns you keep, such as square feet, a drive-through flag or the year each store opened. Pick the column that carries the figure, the trade area every store is measured on, from the saved shape and rings to a drive time, and, if you like, the competitors or anchors to count around each store and the traffic on the nearest counted road. Every store is then measured once, the same way the rest of the product measures a site, and the fit runs in seconds. An estate of fifteen stores is enough to start; sixty or more unlocks the second model below. Included on Pro and Team.
Read how the fit went
A forecast that shows its working, and its error
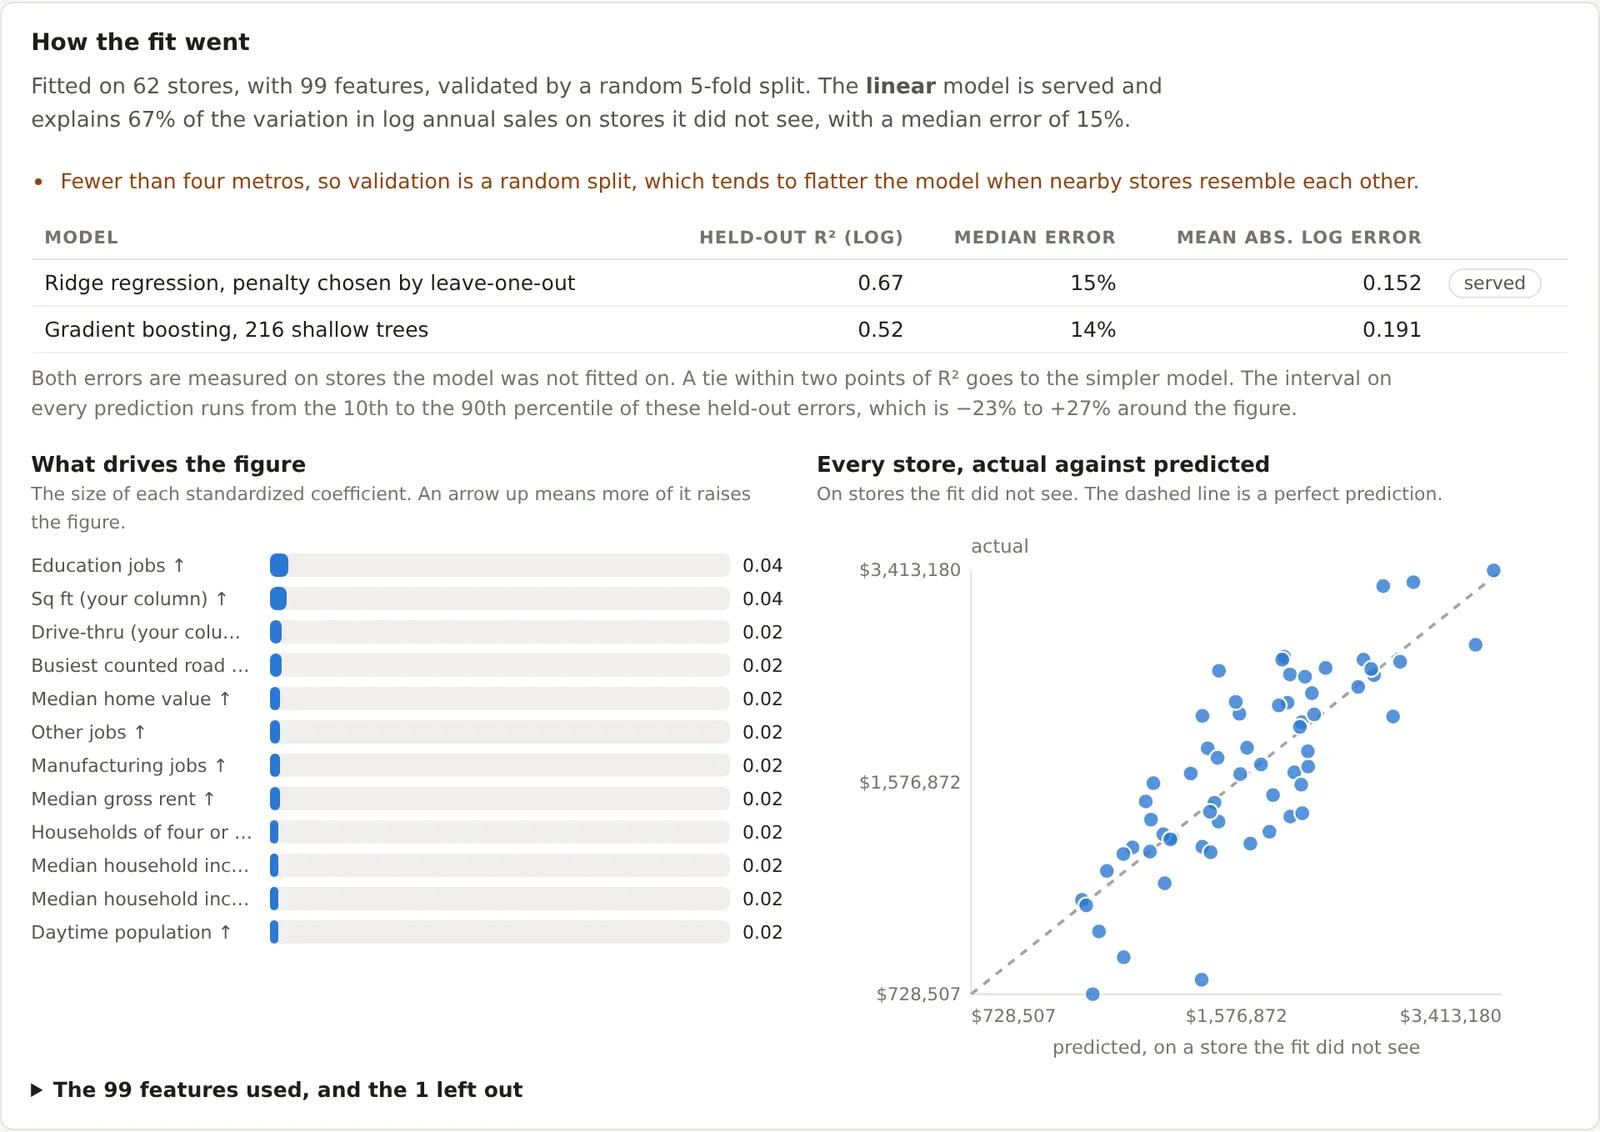
Two models are fitted side by side. A ridge regression shows every coefficient, so you can read that a larger store or a busier arterial raises the figure and by how much. On estates of sixty or more stores a gradient-boosted model of shallow trees is fitted beside it, to catch the thresholds and interactions a straight line misses. Both are tested on stores they were never fitted to, holding out one metro at a time so a model cannot simply memorize a city, and the report prints each one's held-out error in plain terms, the share of the variation it explained and its median miss in percent. On the sample estate the regression explained 67 percent of the variation in stores it had not seen with a median miss of 15 percent, ahead of the boosted model at 52 percent, so the regression is served; a tie goes to the simpler model. Below the table, the drivers of the figure are drawn as bars, every store is plotted actual against predicted, and the full list of features used, with the range the estate spans on each, is one click away.
Score the candidates
Every corner in your own currency, with a range and its reasons
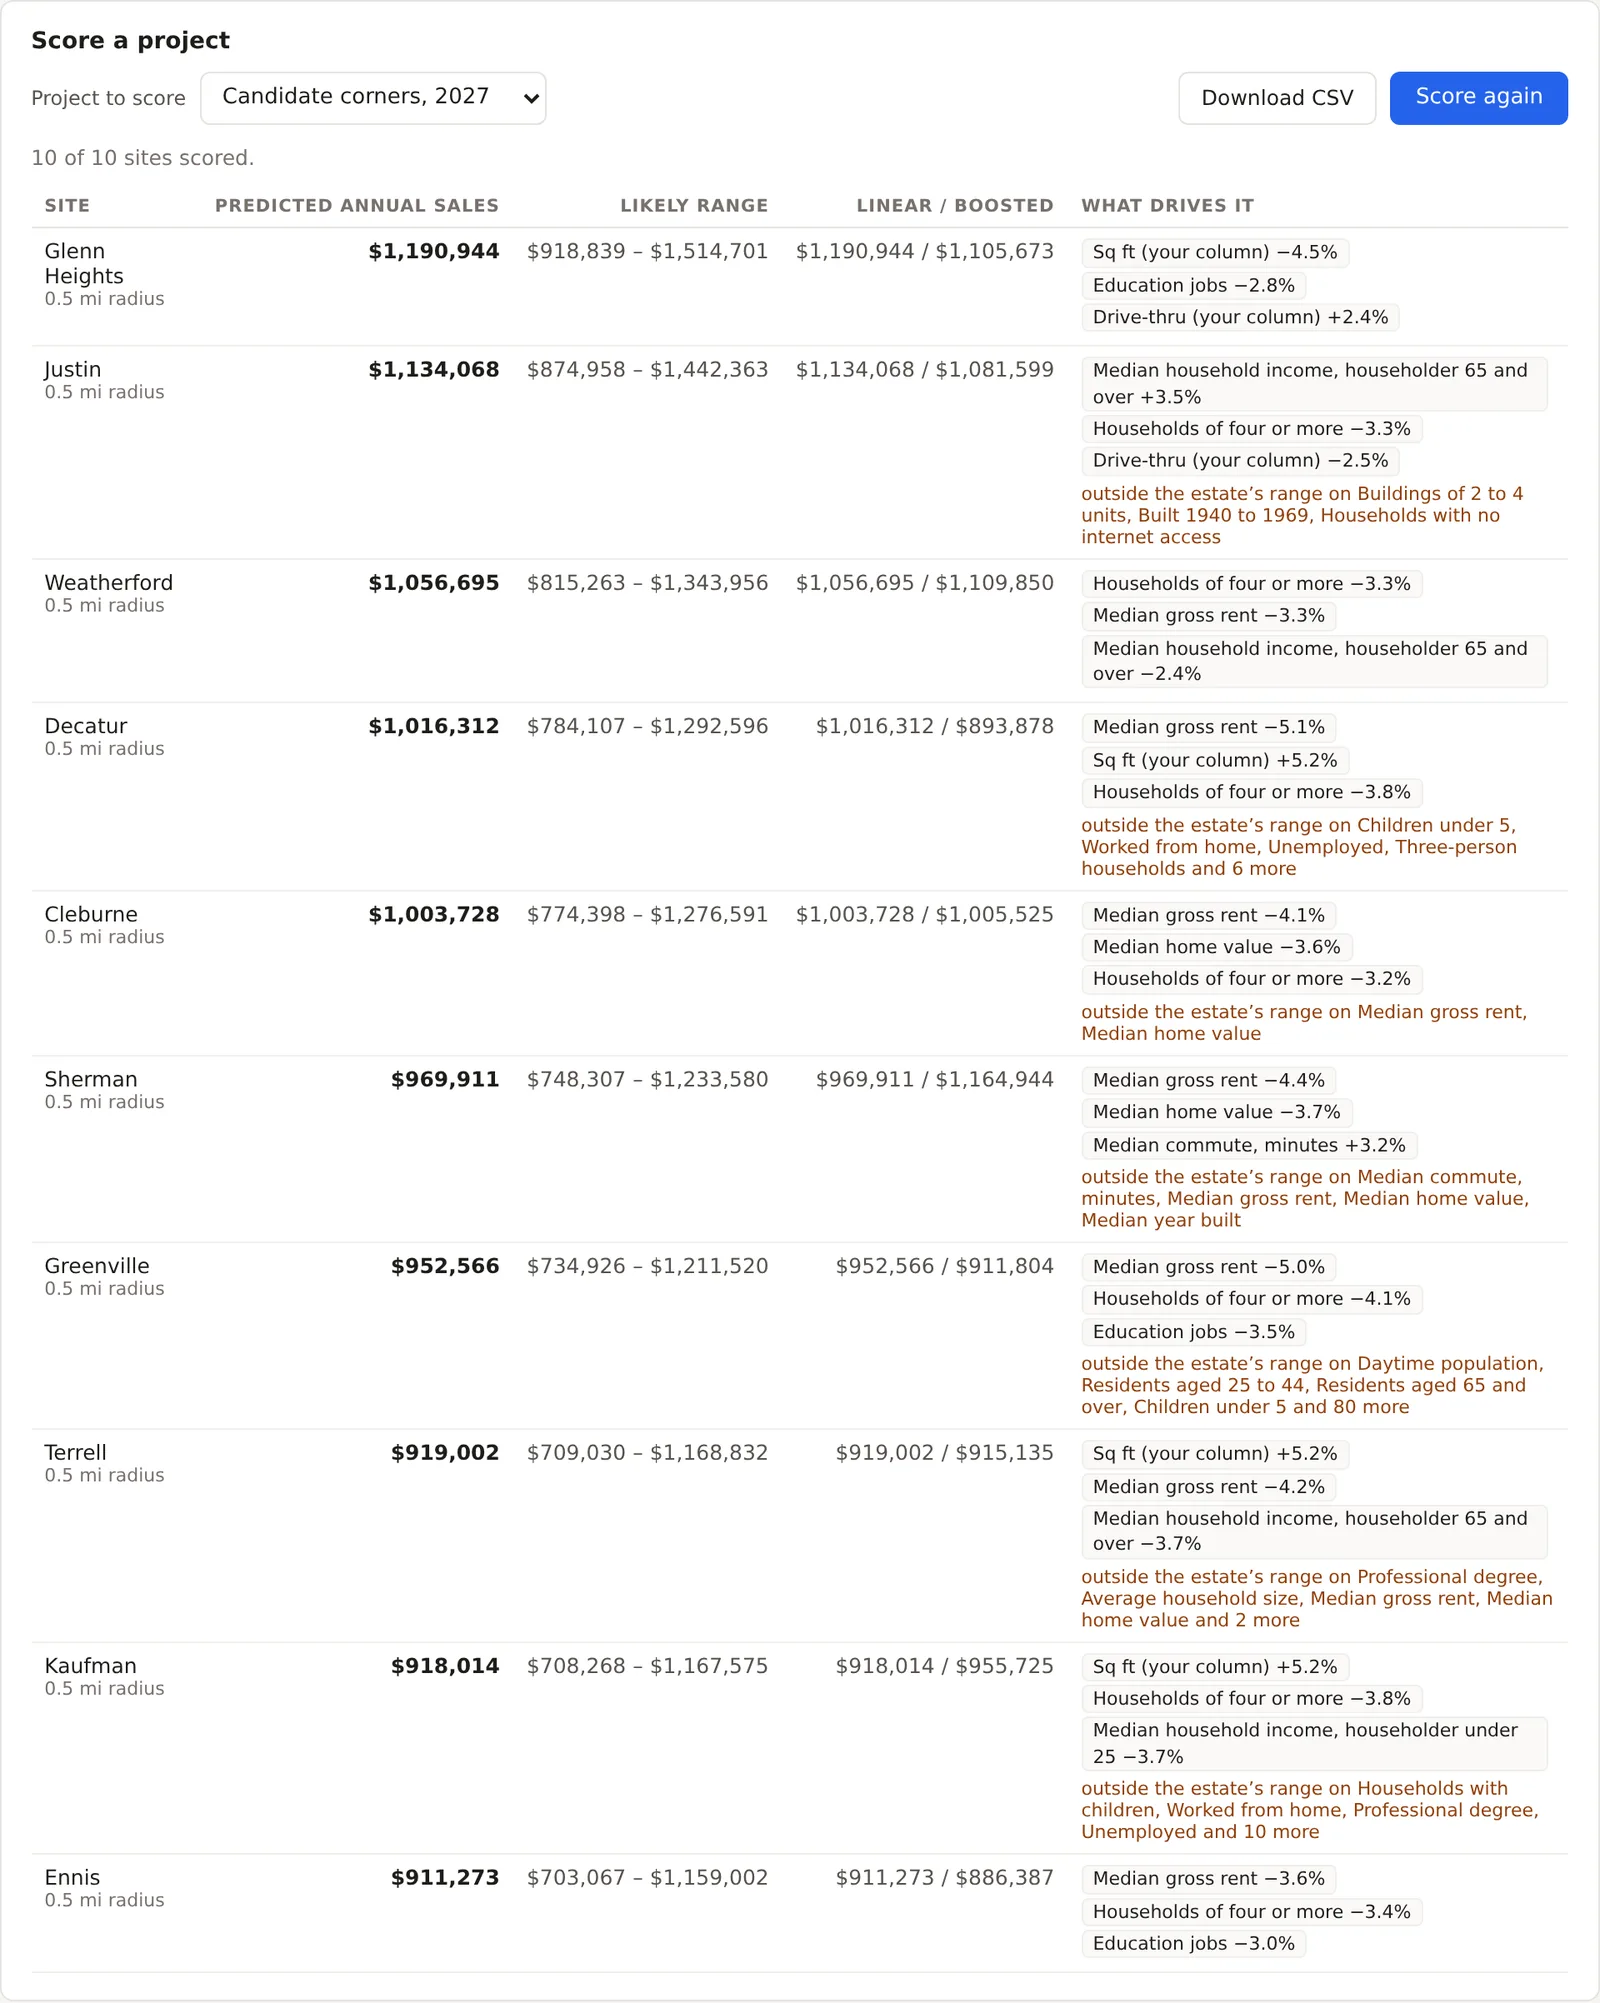
Point the model at any project in your organization, a list of candidate corners you uploaded or drew on the map, and every site comes back with a predicted figure, a likely range, and the three features that pushed it up or down, such as the daytime workforce on the drive, the household income or your own square footage. The range is not decoration: it runs from the 10th to the 90th percentile of the errors the model actually made on your stores, so a wide range is the model telling you what it does not know. A candidate whose features fall outside anything in your estate, a downtown corner for a suburban chain, is flagged rather than scored with false confidence. Save a store and it is scored on the next pass; add stores and refit in one click. The table exports as CSV with every figure and driver.
Why you can defend it
Built to be shown to a committee
A site selection consultant will fit a model like this for a retainer and hand you the answer. MarketGround fits it in minutes to your own estate, and, unlike a number in a slide, everything behind it is on the page: which features, which model, how well it predicted stores it had not seen, and where a candidate sits against the stores you already run. That is what makes the forecast usable in front of a lender or an investment committee. It is honest about its limits too. A forecast explains the part of a store's figure that its trade area explains; the operator, the building and the lease explain the rest, and the report shows how much was left unexplained rather than hiding it.
- Your figures never leave your organization; the model belongs to it and scores only its projects
- Every number has a source, the Census, LEHD, FHWA and the monthly business capture behind each feature
- Validated on stores it did not see, one metro held out at a time
- Refit on demand as your estate grows or a new data release lands
The method in full is on the methodology page.
Keep reading
The features beside these
Every feature is listed by plan on the features page, and how each figure is built is on the methodology page.
Competitors and supply, a market share estimate by travel time, cannibalization across your sites, co-tenancy profiles and chain footprints.
Projects, the criteria screener, the stress test, a sales forecast from your own figures, decision history, an assistant that acts, the PDF report and shareable links.