Commercial real estate location analysis
Understand the market around a commercial property
Add population, employment and demographic information to your property analysis. MarketGround shows who lives nearby, the jobs within an area and how people can reach a location. Bring the results together in a report with your branding.
Every state and the District of Columbia. Branded PDF reports on the paid plans.
The decision
Support property discussions with local data
Tenants, owners and investors need different views of a location. Analyze the surrounding population and jobs, compare household characteristics and review changes over time. Use the results alongside your property information to explain the market around an asset.
A real example
One kilometer around downtown Dallas.
The one-kilometer area around downtown Dallas has 10,554 residents and an estimated daytime population of 122,626. Comparing these measures helps explain the scale of daytime activity around the properties in this area.
| Within one kilometer of downtown Dallas | Figure |
|---|---|
| Residents | 10,554 |
| Daytime population | 122,626 |
| Jobs at workplaces inside the circle | 105,401 |
| Of which office | 54,746 |
| Households | 7,462 |
| Median household income | $93,181 |
| Renter households | 6,624 of 7,462 |
| Listed businesses and places | 3,917 |
| Commute by public transit, against the metro | index 839 |
Swipe the table sideways to see every column.
The table describes a one-kilometer area around downtown Dallas. An index of 100 matches the Dallas Fort Worth metro. See the methodology page for source details.
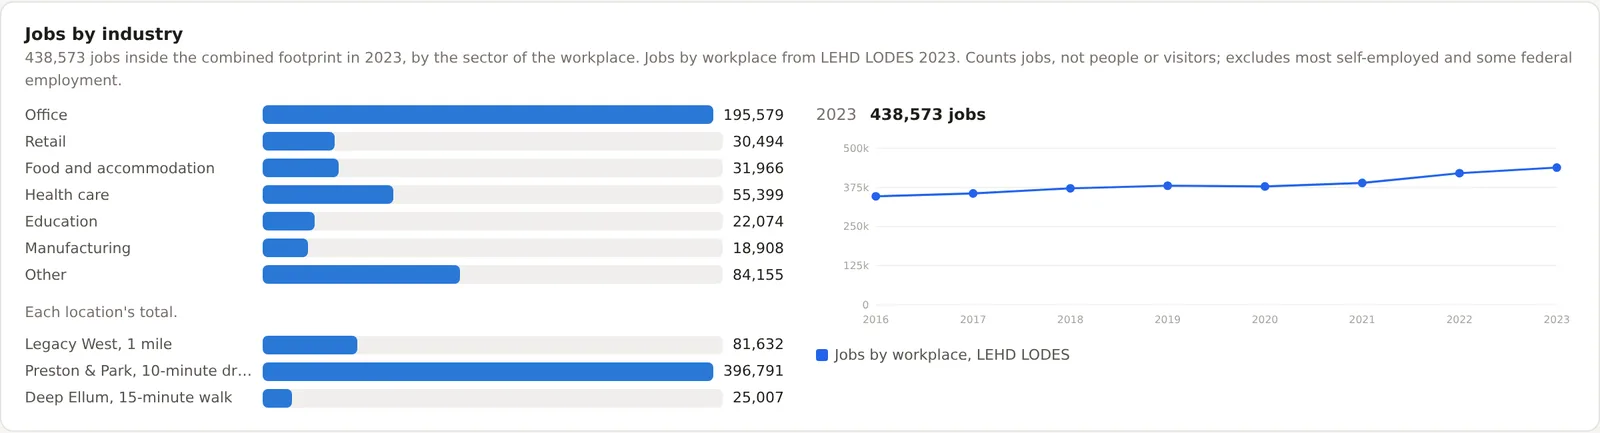
Of the 105,401 jobs in this area, 54,746 are classified as office jobs. Comparing that mix with areas concentrated in health care, education or other industries adds context to a leasing discussion.
Submarkets
Compare a property with its surrounding area
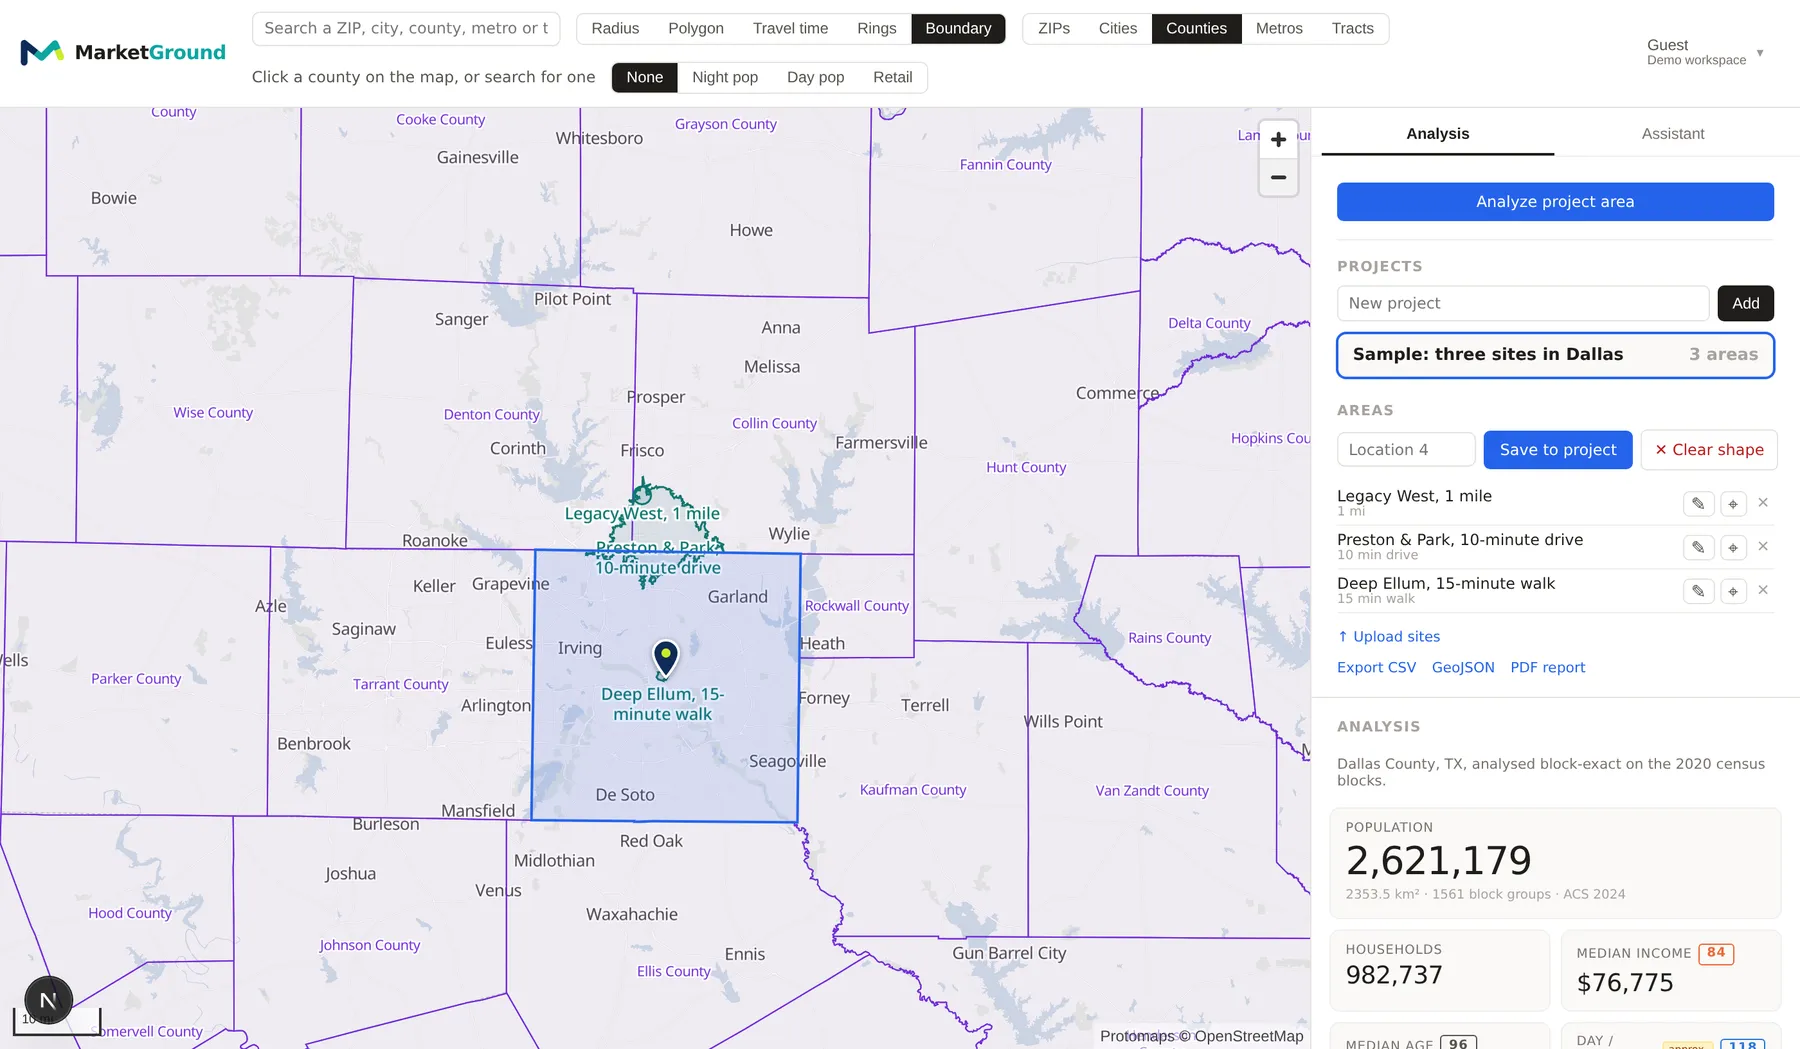
Choose a ZIP area, city, county, metro area or census tract directly from the map. Review the broader market, then analyze the area around the property. Index scores show how its population and demographic characteristics compare with the selected region.
Direction of travel
Review changes over time
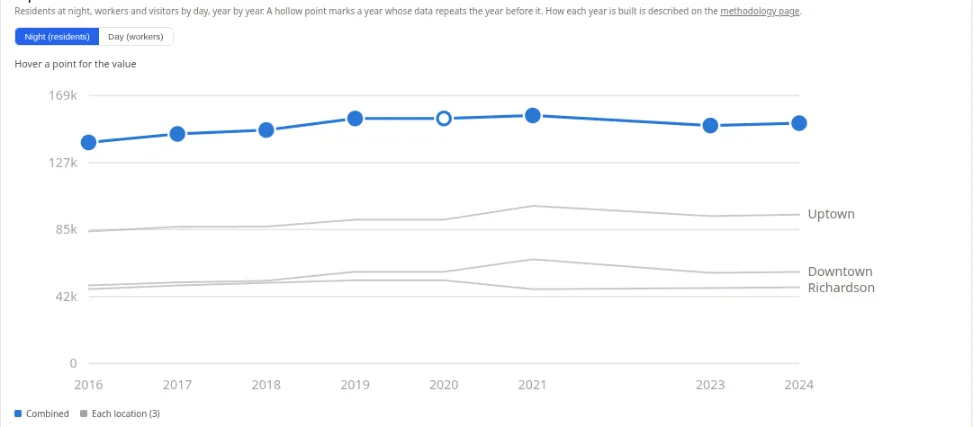
Population and employment history help you assess how an area has changed. Compare each location and the combined project area, then use regional benchmarks to put those changes in context.
See the rest of the reportWhat a broker sends out
Create a report with your branding
Export a PDF with the project map, location comparisons, demographics, employment measures and nearby businesses. The report includes source information and methodological notes. Set your logo, contact information and accent color in settings to use them across your reports.
Questions
Questions people ask
What goes into a location analysis for a commercial property?
Four things, usually. How many people are present around the building during the working day, what kind of work they do, who lives nearby and what they earn, and how easily a customer or an employee can get there. MarketGround produces all four for any outline you draw, along with the businesses already operating inside it.
Can I put my own branding on the report?
Yes. The PDF carries your logo, your contact block and your accent color, set once in your settings. It includes the map with lettered pins, every section of the analysis, numbered notes for figures that are approximate, and a methodology appendix, so a recipient can check where a number came from.
Where do the jobs figures come from?
Employment figures come from the Census Bureau's LEHD Origin-Destination Employment Statistics. MarketGround allocates workplace jobs to the selected area and groups them by industry, with history available for comparison.
Can I analyze a submarket rather than a single building?
Yes. A ZIP area, a city, a county, a metro area or a census tract can be analyzed as itself, picked from the search box or clicked on the map. Counties and census tracts are assembled from their component block groups.
Does it include rents, sales comparables or vacancy?
MarketGround provides population, household, employment and business information for the area around a property. Use it alongside your rent, comparable sales and vacancy information to build a fuller view of the location.
How do I show access rather than distance?
Draw the area as a driving, walking, cycling or public transit time and the shape follows the real network. Paid plans can compute a driving area using typical traffic for a chosen day and hour, which is the difference between a fifteen-minute commute on paper and one at half past five.
Keep reading
Explore the methods and related guides
Read the methodology for sources and calculations, explore the features page or follow the getting started guide. The research section includes studies and practical examples of location analysis.
Define an area and explore its population, income and listed businesses.
Compare candidate stores using nearby households, daytime population and listed businesses.
Compare proposed franchise territories using consistent areas and a report you can share.
Compare residents, daytime population and restaurants around potential locations.
Compare estimated daytime population with residents for the area you choose.
Analyze a current listing
Draw an area around a property you are working on and review its population, jobs and household characteristics. Export a report to see how the analysis fits your property materials.