Daytime population analysis
Explore how population changes between day and night
MarketGround provides resident and daytime population measures for the area you choose. Compare them with local employment data to understand the residential and workplace activity around a location.
Every state and the District of Columbia, for any radius, travel time, ring, polygon or named boundary.
The decision
Include daytime activity in your location analysis
For businesses that serve people during the working day, resident population is one part of the picture. Review the daytime estimate alongside residents and jobs to compare an employment district with a residential neighborhood.
A real example
Compare five areas around Dallas
The table shows resident and daytime population measures for five locations in the Dallas area. Downtown Dallas, Legacy West and Deep Ellum have larger daytime estimates, while Cedar Hill and Garland have larger resident populations.
| Area | Residents | Daytime population | Day against night |
|---|---|---|---|
| Downtown Dallas, 1 km | 10,554 | 122,626 | 11.6 times |
| Legacy West, Plano, 1 mile | 7,891 | 79,980 | 10.1 times |
| Deep Ellum, Dallas, 1 mile | 20,150 | 142,191 | 7.1 times |
| Uptown Village, Cedar Hill, 3 miles | 48,152 | 39,293 | 0.8 times |
| Firewheel, Garland, 3 miles | 99,529 | 70,559 | 0.7 times |
Swipe the table sideways to see every column.
Resident population and estimated daytime population for the selected areas. See the methodology page for sources and data periods.
Firewheel has more than nine times as many residents as the downtown Dallas area, but its daytime estimate is a little over half as large. Considering both measures gives you a different view of the two locations than resident population alone.
Why the crowd is there
Understand the employment mix
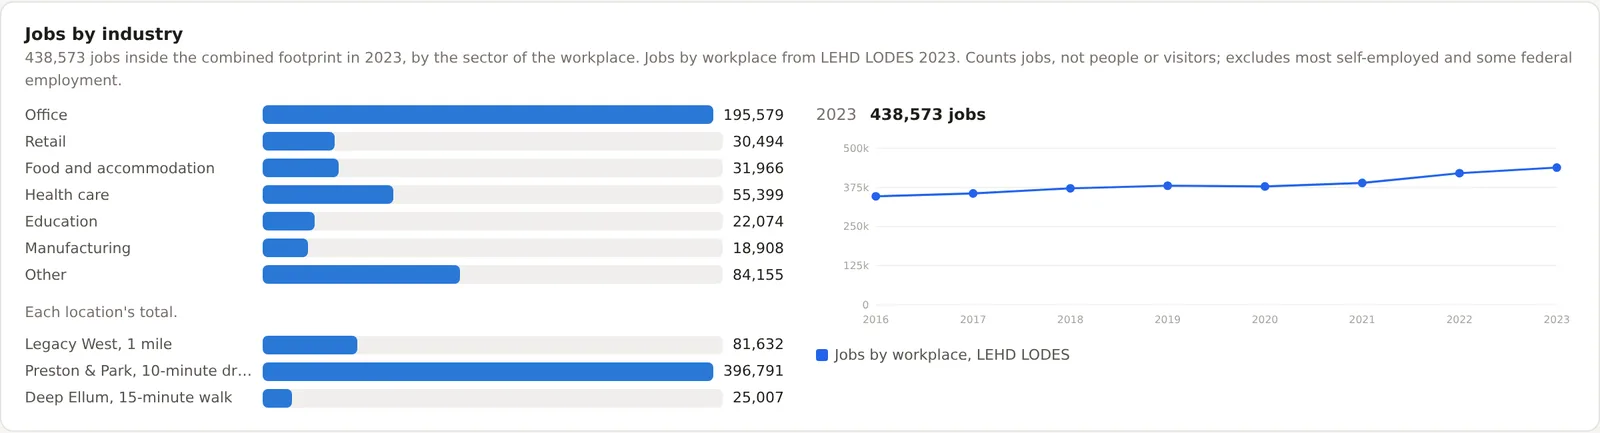
Jobs by industry add context to the daytime population. Compare areas with concentrations of office, retail, health care, education or other workplaces. In the downtown Dallas example, 54,746 of the 105,401 jobs are classified as office jobs.
How it is built
Understand the population measures
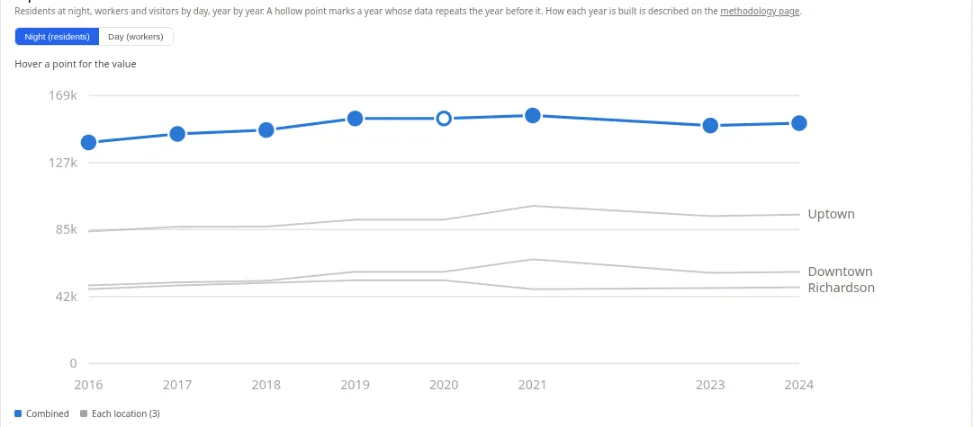
MarketGround uses LandScan USA and Census-based population estimates. The charts show the series separately so you can follow each measure. Daytime population is an estimate built from commuting patterns and calibrated against observed activity, rather than a count of the people passing a door. The methodology page explains how the sources are used and how the daytime model is calculated.
Read the full methodQuestions
Questions people ask
What is daytime population?
Daytime population estimates the number of people present in an area during the working day. Comparing it with the resident population helps you identify areas that attract workers and other daytime activity.
How is it calculated?
The calculation starts with residents, subtracts workers who leave the area and adds workers who arrive. MarketGround applies adjustments and calibration described on the methodology page, then calculates the result for your selected area.
How is it different from foot traffic?
Foot traffic products count devices passing a door and are sold under license with their own sampling biases. Daytime population estimates the people present in an area from public data. The two answer different questions. Ours will not tell you how many people walked past your window on Tuesday, and it will tell you, for anywhere in the country and at no extra cost, how large the workday crowd around that window is.
Can I compare population over time?
Yes. Project reports show population history for each location and the combined area. The methodology page explains the available periods and the sources used for each series.
Why is the figure marked approximate?
Because it is a model rather than a count, and the product says so next to every figure that is one. The resident population is an enumeration and the daytime population is an estimate built on top of it. Telling the two apart matters when somebody is about to sign a lease on the strength of one of them.
Can I get it for a ZIP code or a county?
Yes. Draw any shape, or pick a ZIP area, city, county, metro area or census tract and analyze it as itself. The daytime figure is reported for the outline you chose, with the resident population and the ratio between them beside it.
Keep reading
Explore the methods and related guides
Read the methodology for sources and calculations, explore the features page or follow the getting started guide. The research section includes studies and practical examples of location analysis.
Define an area and explore its population, income and listed businesses.
Compare candidate stores using nearby households, daytime population and listed businesses.
Compare proposed franchise territories using consistent areas and a report you can share.
Compare residents, daytime population and restaurants around potential locations.
Add population, employment, income and travel access information to property analysis.
Explore daytime activity around a familiar location
Select an area you know and compare its resident population, daytime estimate and jobs by industry. Use the results as a starting point for evaluating other locations.