Case study · Retail chains
Comparing hardware store markets before evaluating new sites
An independent MarketGround analysis. The company is not named and is not a customer.
We analyzed ten-minute driving areas around 248 locations of a national hardware cooperative listed in open map data. We then compared five potential Denver locations with those stores. The first step was identifying which existing stores offered the most relevant comparison.
The finding that came first
Separate smaller markets from metropolitan markets
Dividing the stores at 40,000 residents within a ten-minute drive produced two similarly sized groups. There were 123 stores below that threshold and 125 above it. Their surrounding markets differed substantially.
| Measure | Small-town half, 123 stores | Metro half, 125 stores |
|---|---|---|
| Households in the trade area | 4,011 | 53,187 |
| Households per km² | 56.8 | 461.9 |
| Owner-occupied share | 72.2% | 59.0% |
| Median household income | $66,577 | $85,899 |
| Median home value | $241,585 | $394,311 |
Swipe the table sideways to see every column.
Median values for each group, measured within a ten-minute drive of every store.
The metropolitan group had a median of 53,187 households within its driving areas, compared with 4,011 in the smaller-market group. The overall median of 15,763 obscured that difference. For the Denver candidates, the metropolitan group provided a more relevant comparison. Homeownership was common across both groups, with 194 of the 248 stores in areas where the owner-occupied share exceeded 55 percent.
The screen
Five Denver corners, ten minutes by car.
| Candidate | Households | Owner share | Households per km² | Median income | Already served | New reach |
|---|---|---|---|---|---|---|
| Parker, Twenty Mile Road | 43,550 | 73% | 286 | $134,099 | 3% | 114,554 |
| Castle Rock, Allen Way | 31,988 | 70% | 276 | $135,419 | 8% | 77,132 |
| Aurora, Southlands | 55,453 | 80% | 392 | $136,314 | 0% | 160,348 |
| Commerce City, East 104th | 17,877 | 85% | 161 | $131,441 | 25% | 40,654 |
| Highlands Ranch, Dorchester | 55,175 | 79% | 591 | $143,991 | 93% | 9,473 |
Swipe the table sideways to see every column.
Each candidate uses a ten-minute driving area. Already served means residents also within the measured driving areas of the brand's twenty nearby stores.
Using the metropolitan benchmark moved Commerce City from first to fourth in the comparison. Its density of 161 households per square kilometer was close to the overall median of 170 but below the metropolitan median of 462. All five candidates had income and home values above the chain's upper quartile, making them different from its typical markets.
The head to head
Similar demographics with different geographic overlap
Aurora and Highlands Ranch had similar household counts, homeownership shares and incomes. Their overlap with existing locations differed substantially. Aurora had an estimated 160,348 residents outside the measured existing store areas, compared with 9,473 for Highlands Ranch. About 93 percent of the Highlands Ranch population was within an existing store's ten-minute driving area.
A mistake we made, and fixed
Calculate overlap across the combined existing network
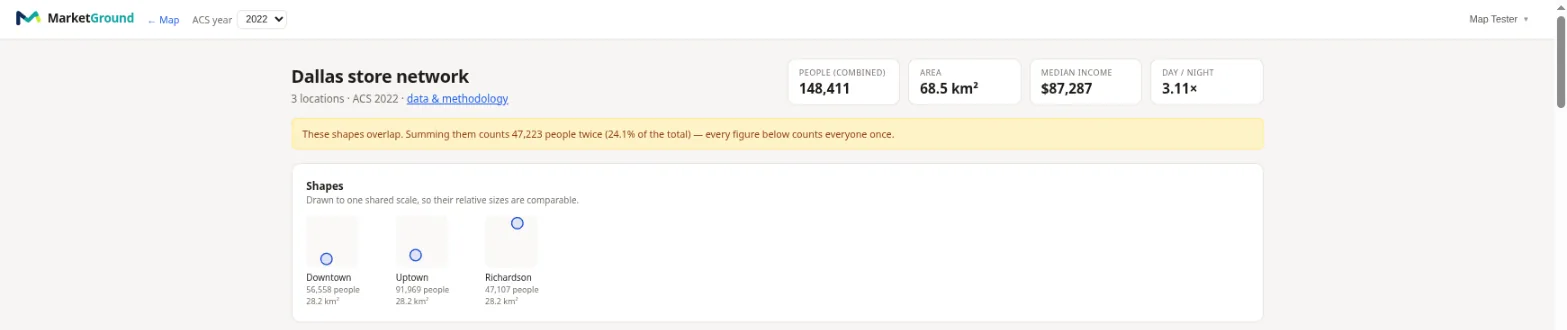
We combined the overlapping intersections into one geographic area before measuring the shared population. This gives each part of the shared area a single contribution to the result. Using that method, Highlands Ranch had 93 percent overlap and Commerce City had 25 percent.
The same arithmetic explains why adding trade areas together overstates the combined reach of a network.
Questions
Questions people ask
Why compare a candidate against the chain's own stores?
A market reads differently depending on where the brand already operates. Analyzing the visible network first gives every candidate a reference drawn from the company's own locations rather than a general average.
How was the existing network measured?
Every store the open place data carries for that brand was analyzed on a ten-minute driving area, the same area used for the candidates, so the comparison is consistent. A chain that uploads its own location list can repeat the exercise across its whole network.
What is the overlap figure?
It is the share of a candidate's resident population within the measured driving areas of existing stores. Comparing that share with residents outside those areas helps describe the geographic reach a new site would add.
Would this work for my chain?
If your locations are in open map data or you can upload them, yes. Import the network, apply the same area around every store, and the middle of your own distribution becomes the reference for every candidate you review afterwards.
About this analysis
MarketGround prepared this analysis independently using public data. The company did not commission or review the work and is described by its industry. The study does not imply an endorsement.
The methodology page describes the sources and calculations used in this analysis.
Case study
A related example
Other trades
Explore other industries
Explore other industry examples or visit the research section for studies and practical guides.
Add local population, employment and travel access information to commercial property analysis.
Evaluate proposed territories and examine their overlap with existing franchise locations.
Compare nearby residents, daytime activity and restaurants when evaluating a location.
Compare candidates with your existing stores
Import your locations and apply a consistent area definition. Use the most relevant groups within your network as references for new candidates.