Study
Measuring the shared population between two territories
A MarketGround study
When trade areas overlap, adding their population estimates includes the shared population more than once. This example compares the individual and combined results for two three-mile areas in Plano.
The example
Two three-mile areas about four miles apart
Site A sits beside Legacy West in north Plano and site B in central Plano, roughly four miles to the south east. Each gets a three-mile area, which is the boundary most franchise agreements are written in. Analyzed on their own, their estimates add up to 233,665 people.
| Area | Residents | Households | Median income | |
|---|---|---|---|---|
| Site A, Legacy West | 73.0 km² | 99,809 | 44,731 | $114,805 |
| Site B, central Plano | 73.0 km² | 133,856 | 51,899 | $119,638 |
| Added together | 146.0 km² | 233,665 | 96,630 | not meaningful |
| Counted once, as a union | 132.0 km² | 209,992 | 87,019 | $116,597 |
Swipe the table sideways to see every column.
The combined median is calculated from the income distribution across the full footprint.
Residents inside two three-mile territories in Plano, Texas.
The two areas share 13.5 square kilometers of ground holding about 23,000 people. Adding the territories includes 23,673 residents and 9,611 households twice, which is ten percent of the figure and considerably more than the difference between many candidate sites.
Why it matters beyond the arithmetic
Compare individual site areas with combined reach
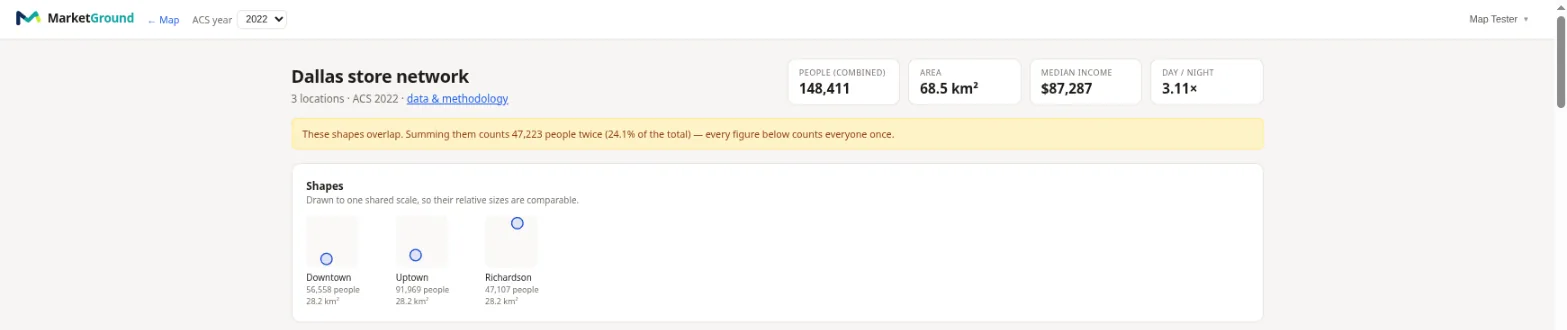
The combined area shows how many residents are within at least one of the two territories. Individual site results show the surrounding market for each location. Reviewing the shared population adds context when evaluating a second location in the same market.
The same approach applies to cumulative rings around one site. A three-mile area already includes the one-mile area. Read each cumulative total on its own, or compare the additional population between consecutive bands.
How to work
Report individual areas and the combined total
Save locations in one project and use the combined area to report total geographic reach. Keep the individual location estimates alongside it and identify the shared population. For rings, compare cumulative areas or the additional population between bands.
Methodology
How these numbers were made
The two three-mile areas are centered at 33.0757, -96.8236 and 33.0480, -96.7590. We analyzed each area separately and then analyzed their geographic union. The methodology page explains the demographic allocation approach.
The overlap figure is the sum of the two minus the union, which is the population counted twice. Analyzing the shared zone directly gives about 23,000 people, a figure that differs by a fraction of a percent because allocating a small shape and a large one treats the block groups on the boundary slightly differently. Either way the conclusion is the same.
The combined area's median household income is calculated from its underlying income distribution. In this example, that produces a median of $116,597 for the full footprint.
Questions
Questions people ask
Why can I not add trade areas together?
Residents in the shared area appear in each individual territory estimate. Analyzing the geographic union produces a combined result that includes each part of the area once.
How big does the error get?
It depends on how close the locations are. In the example on this page, two three-mile areas whose centers are about four miles apart share 23,673 residents, ten percent of the added figure. Move them a mile closer and the shared share grows quickly.
Is overlap a bad thing?
Overlap can support a company's market coverage strategy. Measuring it helps you compare the shared population with the additional geographic reach of another location.
Does the same problem apply to rings around one site?
Yes. A three-mile area already includes the one-mile area. Read each cumulative total on its own, or compare the additional population between consecutive bands.
How does MarketGround handle it?
A project reports its combined footprint as the union of every saved area, with each part of the area counted once, and says on the page how many people fall inside more than one of them. The per-location figures stay separate so you can still compare sites, and the exports carry both.
Keep reading
The rest of the comparison
Franchise site selection works through three candidate sites end to end, and radius and driving areas covers another way the choice of boundary changes a territory figure.
More analysis
Related research
Explore related studies and practical guides. Each article presents a geographic comparison and links to the methods behind it.
Compare daytime population, jobs and listed businesses within the same radius around four Northern Virginia employment centers.
Compare ten-minute driving areas and similarly sized circles around four locations.
Explore how household income varies within one Virginia ZIP area and compare two smaller site areas.
Review overlap in your own network
Save your locations in one project and compare the individual estimates with the combined result. Review the shared population when considering changes to your network.