Study
Comparing daytime population in Northern Virginia
A MarketGround study
We analyzed the same two-kilometer radius around Tysons Corner, Reston Town Center, Dulles Town Center and a data center corridor in Ashburn. The study compares daytime population, jobs and listed businesses within each area.
The finding
Tysons has the largest daytime estimate of the four areas
The Tysons area has an estimated daytime population of 110,559, compared with 15,685 in the Ashburn data center corridor. Their job counts are 105,500 and 10,864. Tysons also has more listed businesses, with 5,435 compared with 741, including 26 coffee shops compared with one. The results describe the different concentrations of employment and business activity within the selected areas.
People present during the working day
The same radius, four different places
Estimated daytime population within a two-kilometer radius. Each selected area covers 12.54 square kilometers.
Listed businesses inside the same area
Listed businesses within the same two-kilometer areas.
Every figure
The four centers, side by side
| Two kilometers around | Residents | Daytime | Day / night | Jobs | Office jobs | Businesses | Coffee shops |
|---|---|---|---|---|---|---|---|
| Tysons Corner | 27,230 | 110,559 | 4.06× | 105,500 | 71,590 | 5,435 | 26 |
| Reston Town Center | 26,026 | 68,951 | 2.65× | 61,517 | 35,459 | 3,286 | 17 |
| Dulles Town Center, Sterling | 15,282 | 24,223 | 1.59× | 18,392 | 3,802 | 2,036 | 11 |
| Data center corridor, Ashburn | 10,137 | 15,685 | 1.55× | 10,864 | 3,914 | 741 | 1 |
Swipe the table sideways to see every column.
The table compares the same radius around each center. Source details are on the methodology page.
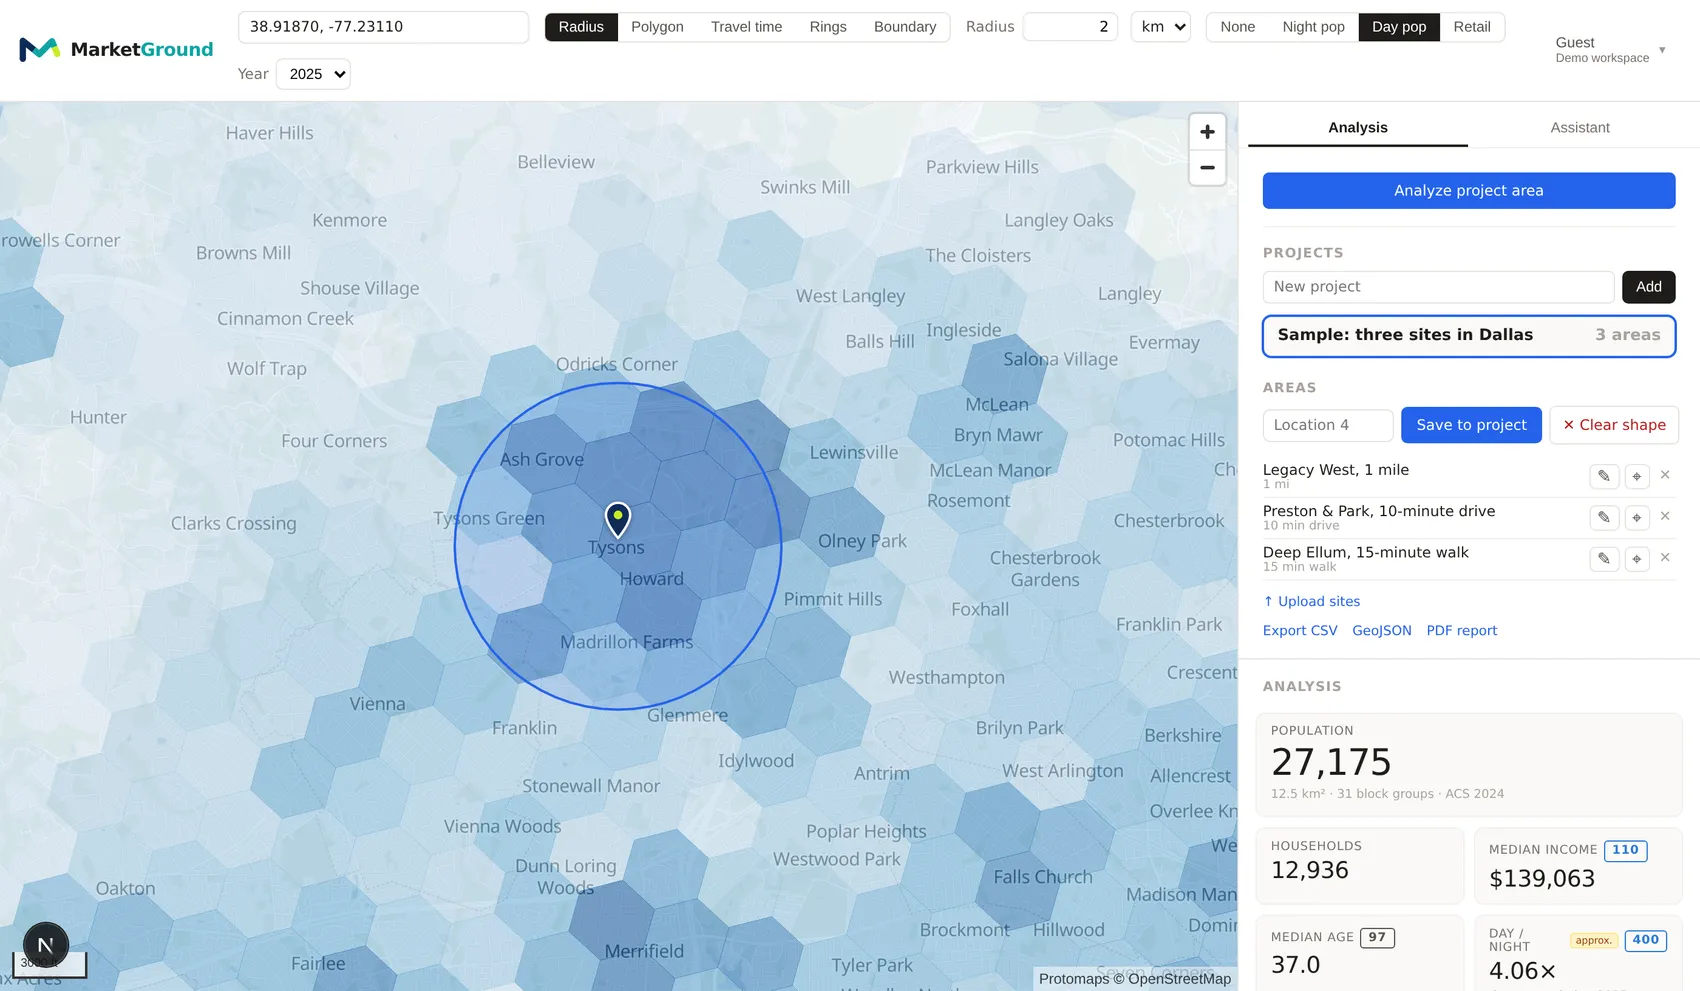
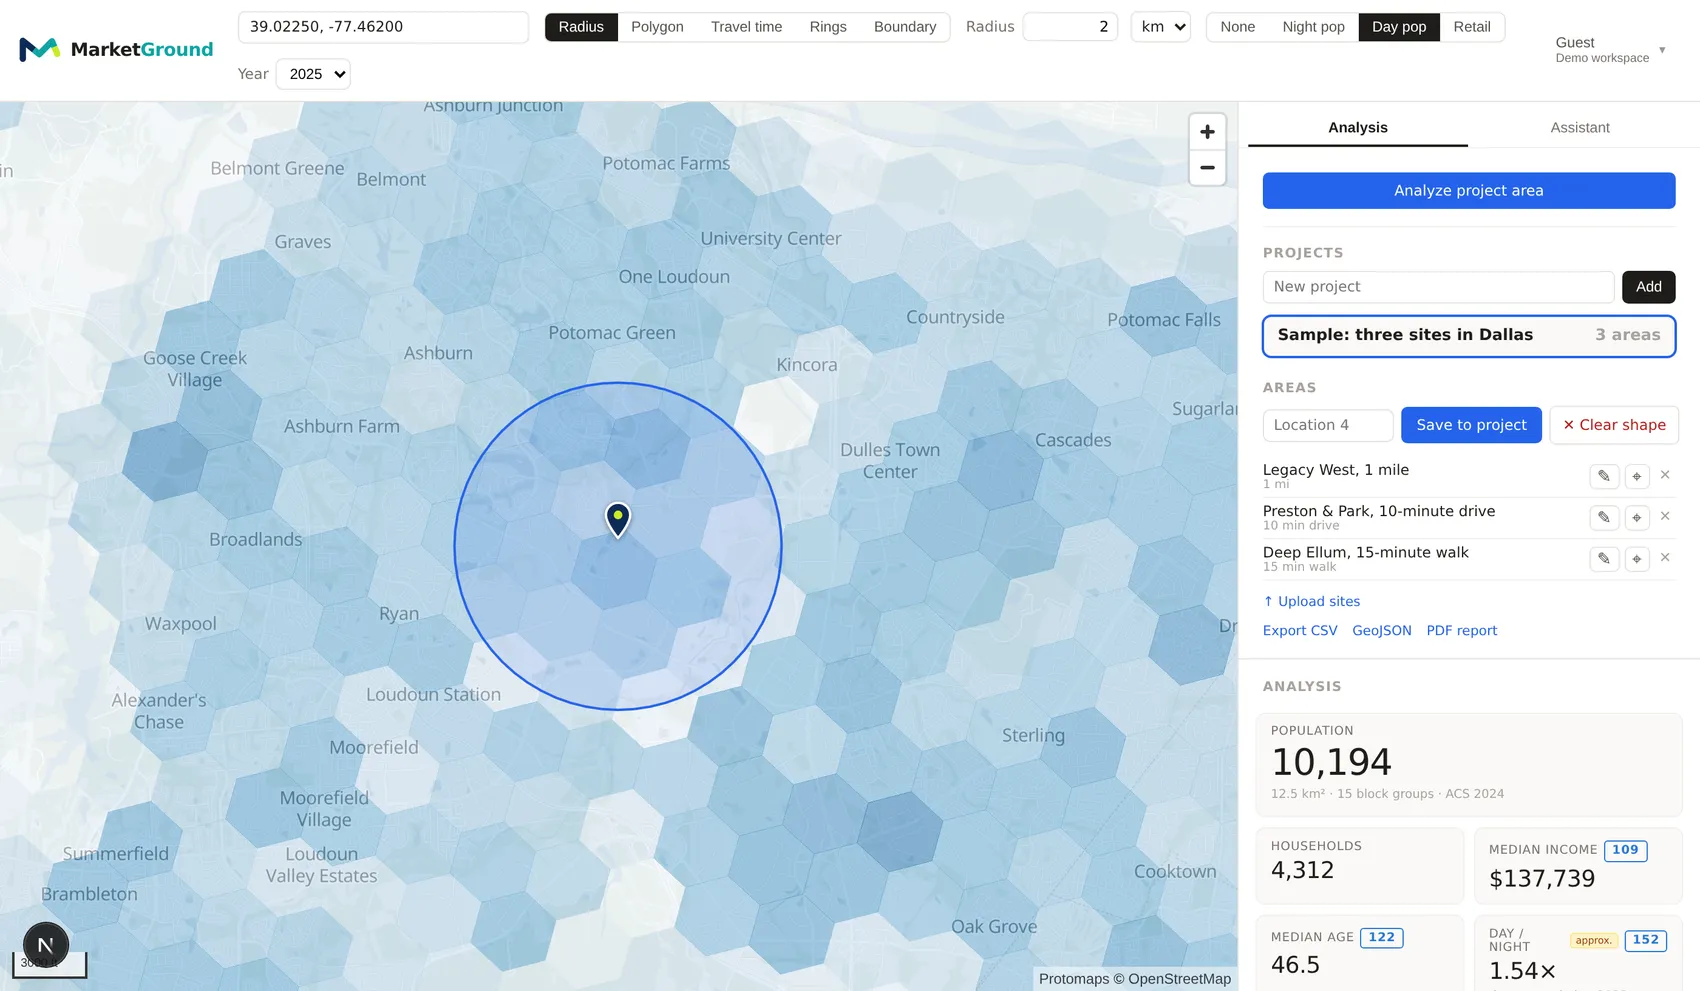
Both maps use the same population layer, color scale and zoom. The darker areas around Tysons show a higher estimated daytime population than the selected Ashburn corridor.
What it means for a retailer
Compare the surrounding residential and daytime markets
The Ashburn area has 10,137 residents in 4,292 households, with a median household income of $137,468 and a median age of 46.5. Its daytime estimate is 1.55 times its resident population. Tysons has a ratio of 4.06 and a median age of 37.1. Dulles Town Center has 2,036 listed businesses alongside a daytime estimate of 24,223. These differences give retailers several ways to compare the four areas.
County context
The two counties these areas sit in
| County | Residents | Households | Daytime | Jobs | Median income |
|---|---|---|---|---|---|
| Loudoun County | 432,998 | 143,032 | 419,375 | 197,530 | $182,385 |
| Fairfax County | 1,147,837 | 414,101 | 1,273,773 | 684,318 | $153,860 |
Swipe the table sideways to see every column.
Each county is analyzed using its geographic boundary. Source details are on the methodology page.
Loudoun's daytime estimate is slightly below its resident population. Fairfax's daytime estimate is higher than its resident population. This county comparison provides context for the individual employment centers.
Take the data
Download the comparison data
The CSV includes the figures shown here, additional household and employment measures, business counts and derived densities. It also includes the center coordinates and radius for each area.
Download the dataset (CSV, 4 rows)Please credit MarketGround and link to this study when using the dataset.
Methodology
How these numbers were made
Each area uses a two-kilometer radius centered on the coordinates below. Census demographic estimates are allocated to the selected area, workplace jobs are aggregated geographically and listed businesses are counted within the boundary. The methodology page provides the calculation details and data periods.
The daytime population is modeled rather than counted. It starts from the Census identity that a place holds its residents, minus those who leave for work, plus those who arrive for work, and is corrected against observed activity from LandScan USA in the years when both exist. It is labeled approximate everywhere it appears in the product, and it counts workers rather than visitors, so a shopping center gets its staff and not its shoppers.
Three caveats matter for this comparison in particular. Jobs data excludes most self-employment and some federal employment, so a district of contractors reads light. Construction crews working on a data center campus are employed by firms based elsewhere and are not counted at the campus, which means the Ashburn figure describes the permanent daytime economy rather than the building site. And a place count counts locations, not floor area or revenue, so 741 businesses in Ashburn and 5,435 at Tysons is a statement about density rather than about turnover.
| Center | Latitude, longitude | Radius | Area |
|---|---|---|---|
| Tysons Corner | 38.9187, -77.2311 | 2 km | 12.54 km² |
| Reston Town Center | 38.9586, -77.3570 | 2 km | 12.54 km² |
| Dulles Town Center, Sterling | 39.0243, -77.4083 | 2 km | 12.54 km² |
| Data center corridor, Ashburn | 39.0225, -77.4620 | 2 km | 12.54 km² |
Swipe the table sideways to see every column.
This article contains the updated comparison and downloadable results for the four selected areas.
Questions
Questions people ask
What is daytime population and why does it differ from the census figure?
The resident measure describes where people live, while daytime population estimates how many people are present during the working day. Within the Tysons study area, the resident population is 27,230 and the daytime estimate is 110,559.
How many jobs are inside the Ashburn data center corridor?
The Ashburn area has 10,864 reported workplace jobs, compared with 105,500 around Tysons Corner. That is about 866 and 8,413 jobs per square kilometer respectively.
What does the comparison show about the data center corridor?
The selected Ashburn area has lower concentrations of jobs, modeled daytime population and listed businesses than Tysons. The comparison describes these local measures within the same geographic area.
Why a two-kilometer radius?
It is small enough to describe a single center rather than a whole suburb, large enough to include the parking, the approach roads and the immediate retail, and identical for all four places, which is what makes the comparison consistent. Each area covers 12.54 square kilometers.
Can I reproduce these numbers?
Yes. Use the published center coordinates and a two-kilometer radius for each location. The downloadable file contains the comparison figures, and the methodology page explains the sources and calculation approach.
Can I cite this?
Yes. Credit MarketGround and link to this study. Contact us if you would like to discuss another measure or location.
Run it yourself
Run it yourself
Everything on this page came from drawing areas on a map and reading the panel. The same applies to your own corridor, whether the question is a data center cluster, a hospital campus, a university or a shopping center. Start with daytime population analysis for what the figure is and how it is built, or the methodology page for every source in one place.
More analysis
Related research
Explore related studies and practical guides. Each article presents a geographic comparison and links to the methods behind it.
Compare ten-minute driving areas and similarly sized circles around four locations.
Explore how household income varies within one Virginia ZIP area and compare two smaller site areas.
See how overlapping territories change the combined population estimate for two Plano locations.
Explore an area in your community
Use a free account to draw a radius and review the included measures. Contact us if you would like to discuss another area for a future study.