The Income & Housing tab
How much people earn and what the housing is like, with the income and housing strips, the distributions the medians are worked out from, tenure, housing type, year built, bedrooms, rent as a share of income, vehicles, and the two tables by age of householder.
What this is for
The Income & Housing tab answers "How much do people here earn, and what is the housing like?". Income tells a business what its customers can spend and housing tells it how they live, whether they own or rent, in houses or apartments, old buildings or new, and whether they have a car. The two go together because they explain one another. A neighborhood of renters in new five-story buildings with no cars and high incomes is a particular kind of place, and the tab shows all of that on one screen.
Where to find it
Choose Income & Housing in the row of tabs. The strips, the distributions and the proportion bars are included in every plan. The two tables by age of householder at the foot are part of the Pro and Team plans.
The income strip
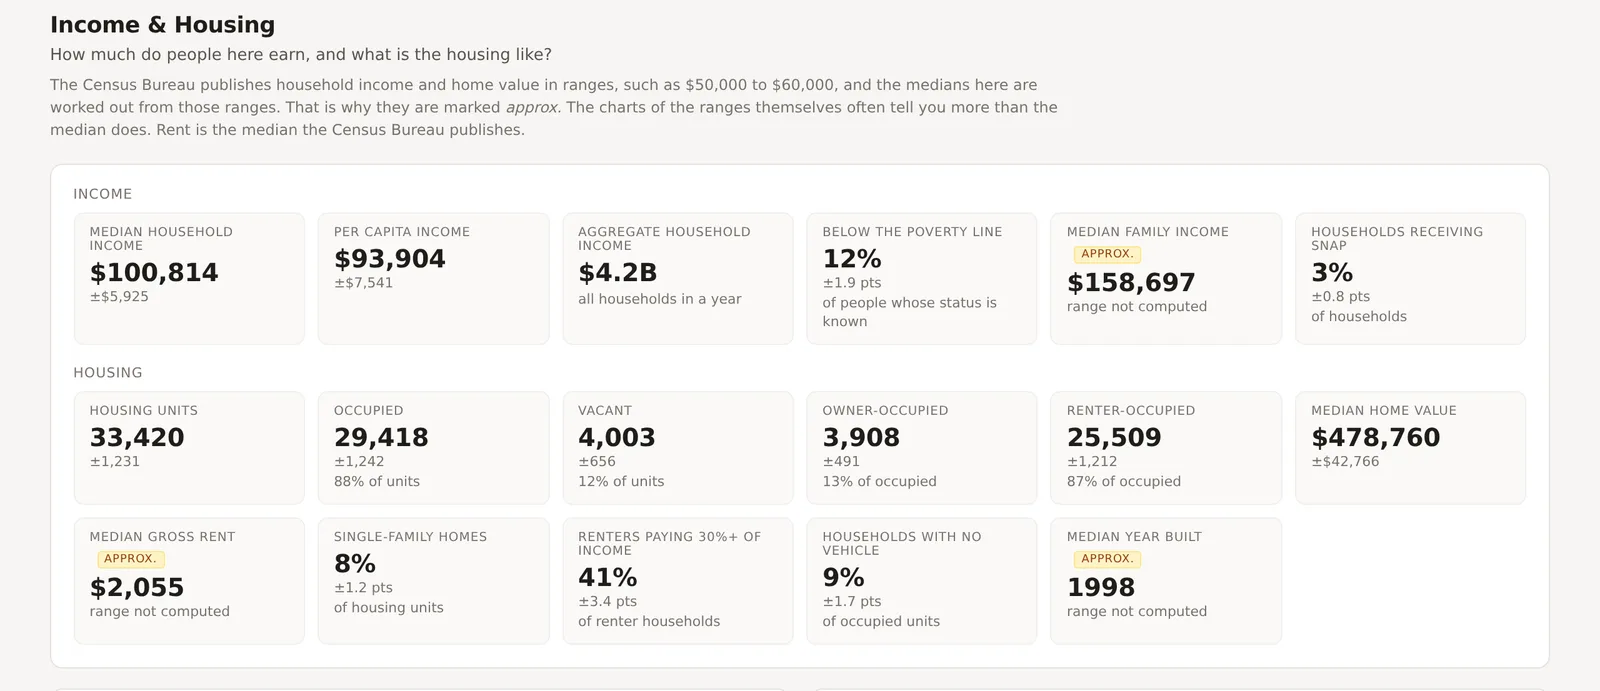
Median household income, the income of the household in the middle, with half above and half below. Per capita income, total income divided by every resident, children included. Aggregate household income, the total earned by all households in a year, which is the figure that sizes a market in dollars. Below the poverty line, as a share of people whose poverty status is known. Median family income, the same median for family households alone, which is usually higher. Households receiving SNAP, food assistance, as a share of households.
The two medians are marked approximate because the Census Bureau publishes income in ranges, such as $50,000 to $60,000, and the product works the median out from those ranges for your exact area. The methodology page explains how and how closely the result matches a published median. The household median carries a range, and the family median says range not computed because no honest range exists for it.
The housing strip
Housing units, every home whether lived in or not. Occupied and Vacant, as counts and as shares of units. Owner-occupied and Renter-occupied, as shares of occupied homes. Median home value, of owner-occupied homes, worked out from the Census ranges as income is. Median gross rent, the median the Census Bureau publishes, blended from published medians and so marked approximate with no range. Single-family homes, as a share of housing units. Renters paying 30 percent or more of income on rent, the usual measure of being cost burdened. Households with no vehicle. Median year built, worked out from the ranges.
The distributions
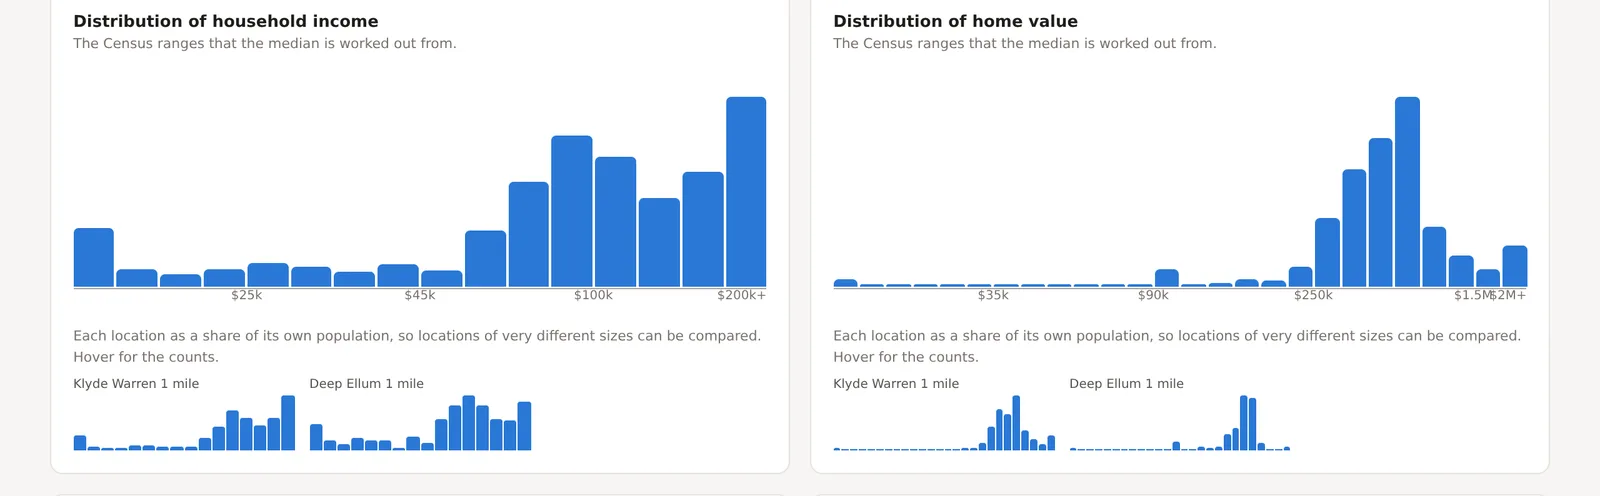
Two charts of the ranges the medians come from, household income and home value. Each bar is the number of households or homes in one range, and the bars often say more than the median does. Two areas can share a median income of $100,000, one with most households near it and the other with half at $40,000 and half at $200,000, and the chart shows the difference at once. When several locations are compared, a small chart for each appears beneath, as a share of its own households, so that locations of very different sizes can be compared by shape. Hover a bar for its count.
Tenure, type, year built, bedrooms, rent burden and vehicles
Six cards of proportion bars.
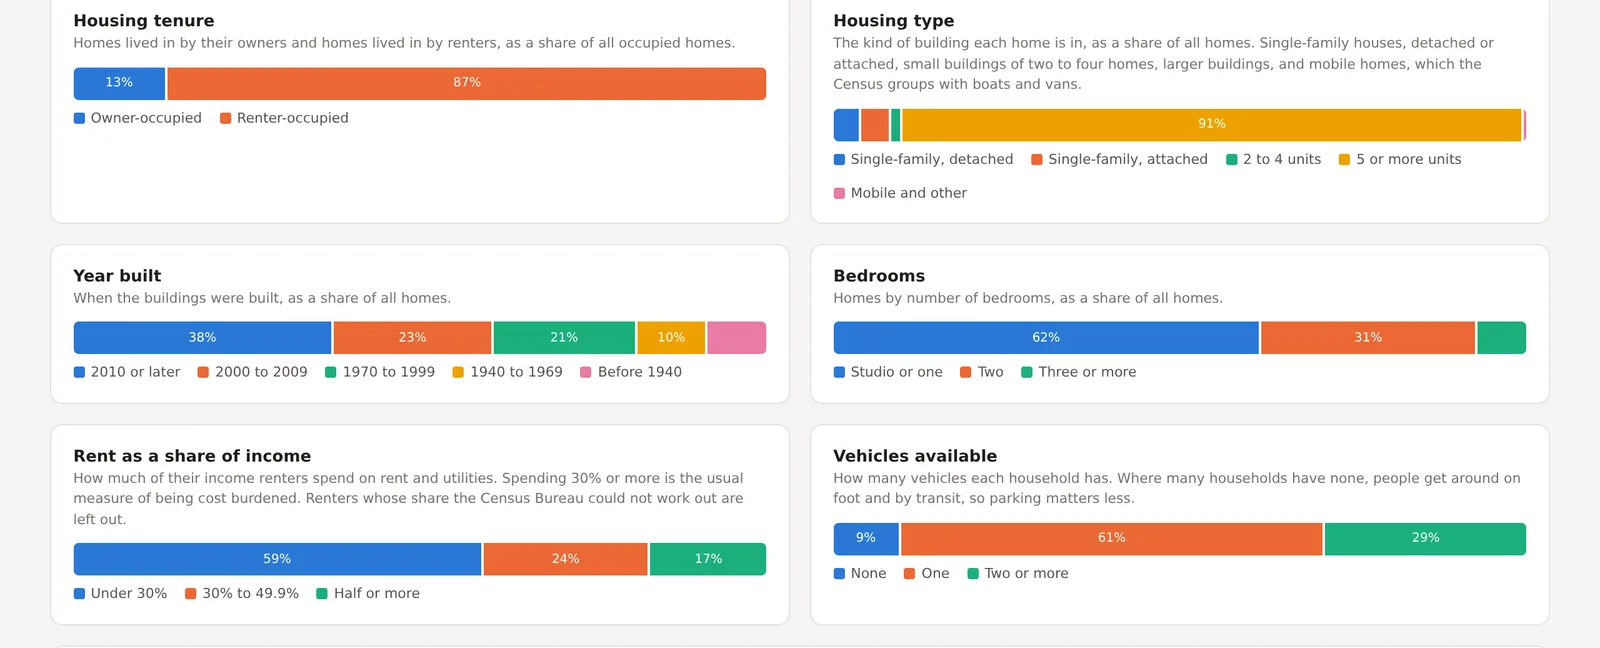
Housing tenure splits occupied homes into owner-occupied and renter-occupied. Housing type splits all homes by the building they are in, single-family detached, single-family attached, two to four units, five or more units, and mobile homes and other, which the Census Bureau groups with boats and vans. Year built splits homes by when the building went up, from 2010 or later back to before 1940. Bedrooms splits homes into studio or one bedroom, two, and three or more. Rent as a share of income splits renter households into those paying under 30 percent, 30 to 49.9 percent, and half or more of their income on rent and utilities, with renters the Bureau could not work out left out. Vehicles available splits households into none, one, and two or more.
Hover a segment for its count and range. Anything the named categories do not cover is drawn as its own segment.
The two householder tables
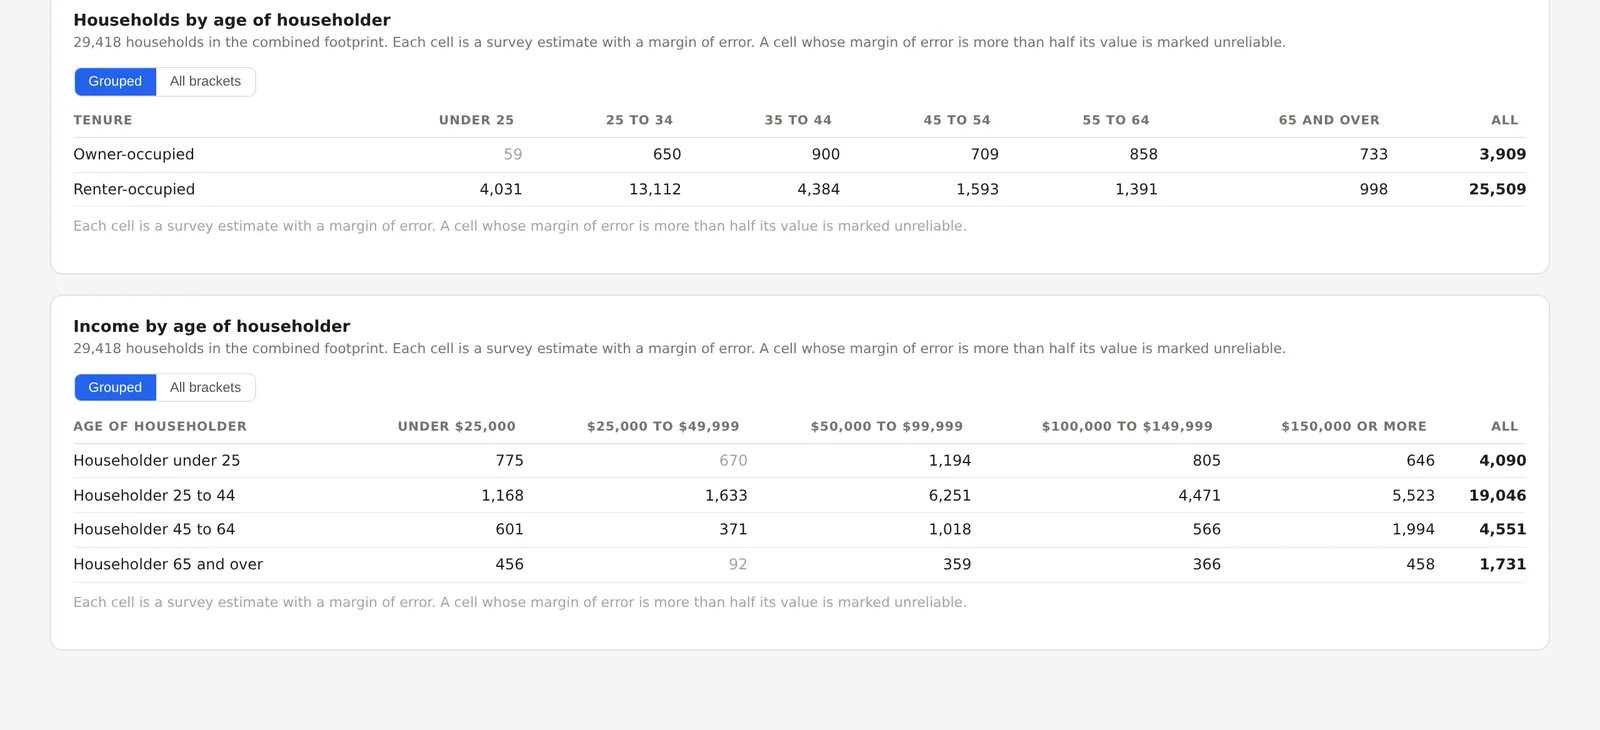
Households by age of householder is a grid of tenure, owner or renter, against the age of the householder, under 25, 25 to 34, and so on to 65 and over. Income by age of householder is a grid of income range against four age groups. Both have Grouped and All brackets buttons for the industry's groups and the Bureau's full list. Each cell is a survey estimate with a range, and a faded cell is unreliable for this area. These tables are where the spending figures on the Economy tab come from, because what a household spends depends on its income and the householder's age together.
An example
The Downtown Dallas project on 30 October 2026 read a median household income of $100,814 with a range of plus or minus $5,925, per capita income of $93,904, aggregate household income of $4.2 billion a year, 12 percent below the poverty line and 3 percent of households receiving SNAP. Its housing read 33,420 units, 88 percent occupied, 87 percent of occupied homes rented, a median home value of $478,760, median gross rent of $2,055, 8 percent single-family homes, 41 percent of renters paying 30 percent or more of income, 9 percent of households with no vehicle, and a median year built of 1998. The housing type bar read 91 percent in buildings of five or more units, and the income distribution climbed toward the $200,000 and over bracket. Those figures together describe a downtown of well paid renters in new apartment towers, which is what a reader needs to know before choosing a store format for it.
Things to know
Median household income is for households, and per capita income is per person including children, so a neighborhood of large families has a per capita figure far below its household median, and a neighborhood of one-person households has the two close together.
Home value is the owner's own estimate of what the home would sell for, as the survey asks it, not a sale price or an appraisal.
Rent burden leaves out renters whose share could not be computed, which the card says, so the three segments add up to the renters with a known share rather than to all renters.
Related pages
The People tab comes before this one and The Work & Movement tab after. The Economy tab builds its spending and affordability indexes on these figures. The methodology page explains how a median is rebuilt from ranges and how close it comes.