The People tab
Who lives in the market, with the headline strip, race and ethnicity, household size, internet at home, the age and sex pyramid, households with children and education by sex, and how to read each.
What this is for
The People tab answers the question the product asks at its top, "Who lives in this market?". It describes the residents of the project's combined footprint, each counted once, as the American Community Survey describes them, by age, sex, origin, household, education and a few other things a business cares about, such as whether homes have internet and whether people have health insurance.
Everything on the tab is about residents, the people who sleep in the area. Who is there during the day is on the Work & Movement tab.
Where to find it
Choose People in the row of tabs on the analysis page. The strip and the proportion bars are included in every plan. The combined tables lower down, age by sex, households with children and education by sex, are part of the Pro and Team plans, and a free account sees one card saying so where they would be.
The headline strip
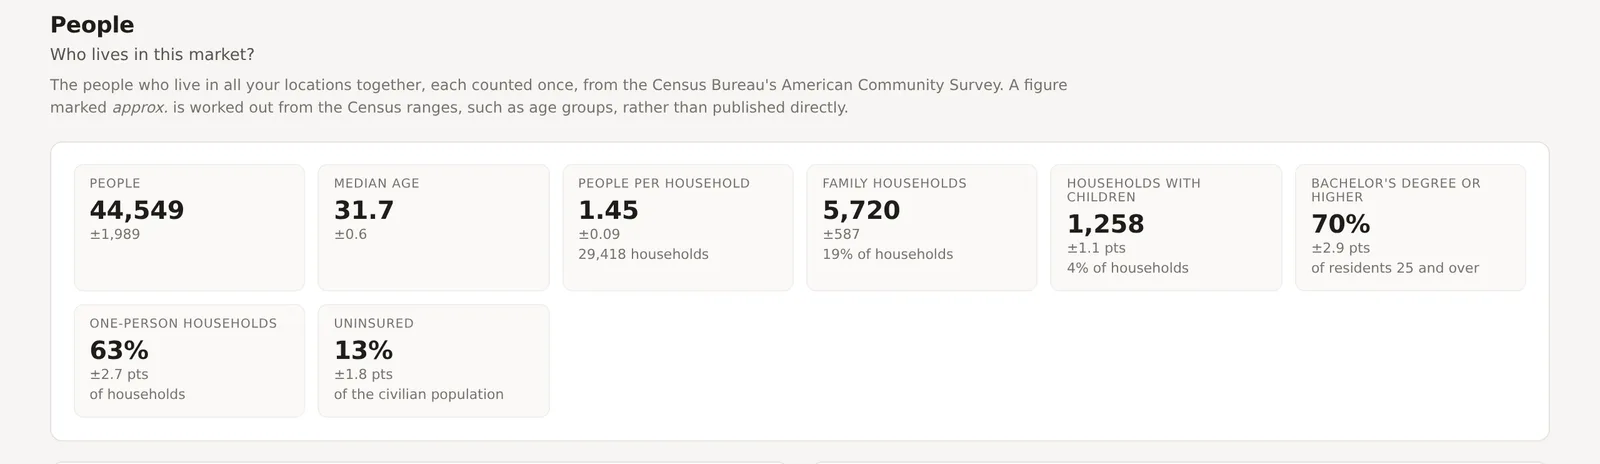
Eight tiles. People, the residents of the combined footprint. Median age. People per household, the average household size, with the number of households beneath. Family households, the households of people related to one another, as a share of all households. Households with children, with people under 18, as a share. Bachelor's degree or higher, of residents 25 and over. One-person households, as a share. Uninsured, people without health insurance, as a share of the civilian population. Each survey figure carries its range, and a figure marked approximate is worked out from the Census ranges rather than published directly, as median age is.
Race and ethnicity, household size and internet at home
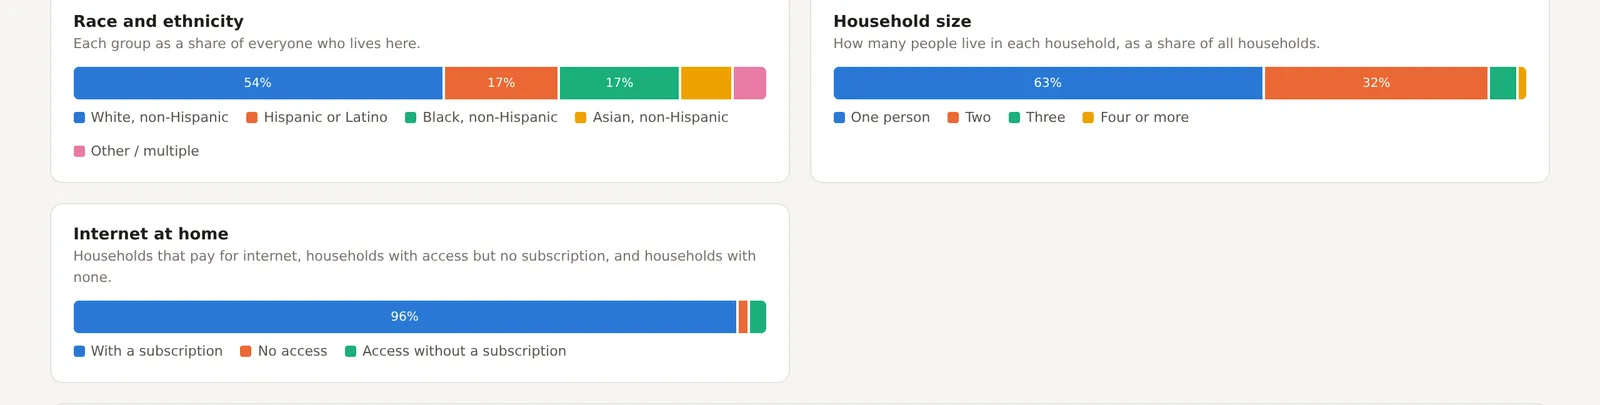
Three cards of proportion bars, each a single bar divided into labeled segments that add up to everyone.
Race and ethnicity gives each group as a share of everyone who lives in the area, in the Census Bureau's categories, namely White, Hispanic or Latino, Black, Asian, and other or multiple, with Hispanic or Latino counted as its own group and the others as non-Hispanic, so the segments do not double count.
Household size gives households by how many people live in them, one, two, three, and four or more.
Internet at home gives households that pay for an internet subscription, households with access but no subscription, and households with none. A business that sells online or expects customers to book online reads this card first.
Anything the named categories do not cover is drawn as its own segment rather than hidden, because the remainder is real people. Hover a segment for its count and range.
Age and sex
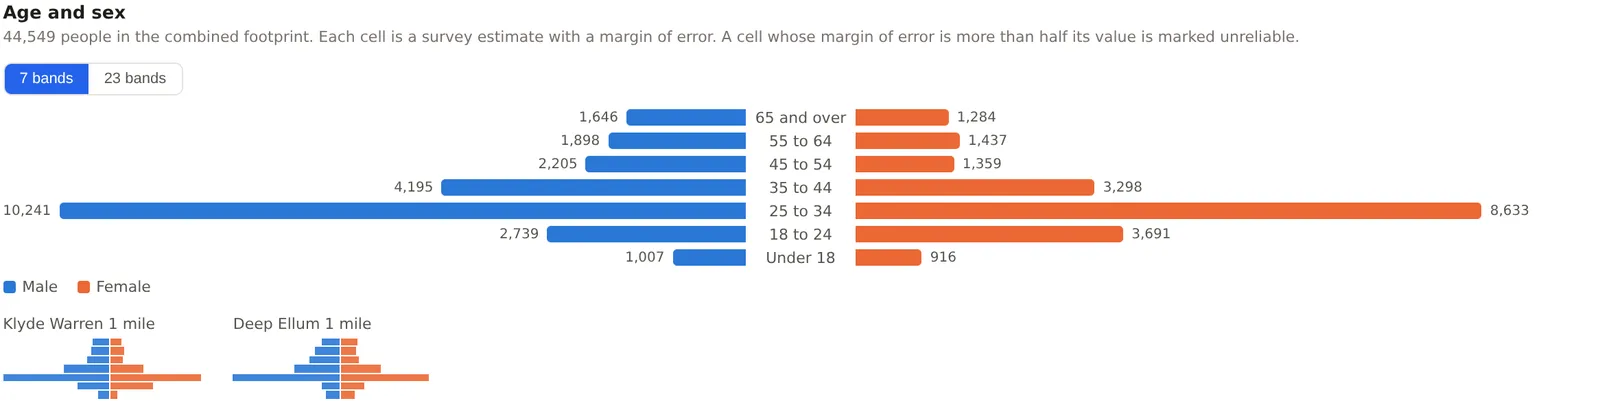
A population pyramid, with men on the left and women on the right and an age band on each row, so that the shape of the population reads at a glance. A wide middle is a working age neighborhood, a wide base is one with many children, and a wide top is a retirement community. The 7 bands and 23 bands buttons switch between the broad groups the industry uses and the Census Bureau's own fine bands. When several locations are compared, a small pyramid for each appears beneath the combined one, so that two sites with the same median age can be seen to have different shapes.
Each cell is a survey estimate with its own range, and a cell whose range is more than half its value is faded as unreliable, which happens in the oldest bands of a small area. Hover a bar for its figure and range.
Households with children
A grid of household type against whether there are children under 18, so that the number of married couples with children, single parents of either sex and nonfamily households with no children can each be read. The right hand column totals each row and the bottom row totals each column. A faded cell is one the survey could not estimate reliably for this area.

Education by sex
A grid of educational attainment for residents 25 and over, by sex, from less than ninth grade to a graduate or professional degree. The Grouped and All brackets buttons switch between the usual groups and the Census Bureau's full list. A business whose customers are defined by education, a bookstore or a tutoring center, reads this grid rather than the single share in the strip.
An example
The Downtown Dallas project on 30 October 2026 read 44,549 people with a median age of 31.7, 1.45 people per household, only 4 percent of households with children and 63 percent one-person households, 70 percent of adults with a bachelor's degree or higher, and 13 percent of people uninsured. Its race and ethnicity bar read 54 percent White, 17 percent Hispanic or Latino, 17 percent Black and 8 percent Asian. The pyramid's 25 to 34 band held 10,241 men and 8,633 women, far more than any other band, which is the shape of a downtown of young professionals in apartments and the reason the share of households with children is so low.
Things to know
The tab describes residents only. A downtown with few residents reads as a small place here however busy it is by day.
A share in the strip is a share of the right universe, which the context line names. Bachelor's degree or higher is a share of residents 25 and over, not of everyone, and uninsured is a share of the civilian population, since the survey does not ask the military.
The grids compare the combined footprint. To see one location's grid, open a project holding only that location, or read the location's row in the Compare tab.
Related pages
The Income & Housing tab is next. The analysis page explains ranges and chips, and the methodology page explains how a grid cell's reliability is judged.