The Economy tab and how an index is read
The tab that puts an area's money on one scale, with the summary table of indexes against the nation, the range and the dashed index, the metro and county columns, the cards beneath, the indexes by location, and what a withheld index means.
What this is for
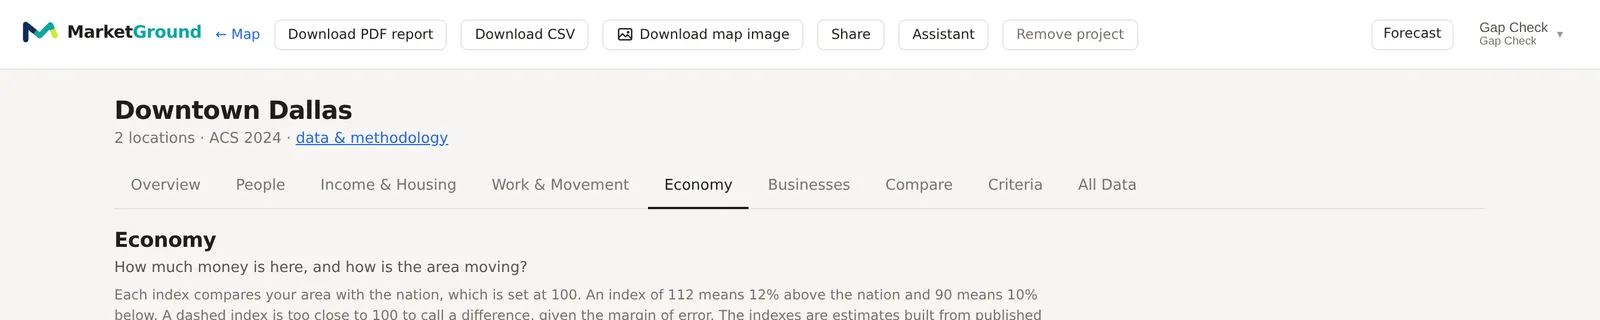
The Economy tab answers "How much money is here, and how is the area moving?". The other tabs describe an area in counts and shares. This one describes it in comparisons, as a set of indexes that each put one question about the area's economy on a scale with the nation at 100, so that a reader can see at a glance whether an area is richer or poorer, more or less affordable, growing faster or slower, than the country as a whole, and by how much.
There are eleven of them, plus the spending potential table in dollars. Each has a page of its own in this part. This page explains what every index shares, namely how it is scaled, what its range means, how the metro and county columns relate to it, and why one is sometimes withheld.
Where to find it
Choose Economy in the row of tabs on the analysis page. The tab is part of the Pro and Team plans. The row of links under its question jumps to each card, and the same indexes appear beside every other figure in All Data and the CSV export, and in the report's Economy part.
How an index is scaled
Each index is the same figure computed for the area and for the nation, and 100 times their ratio. The nation therefore reads 100, 112 means 12 percent above the nation, and 90 means 10 percent below. Most indexes are built from two or three parts, each set against the nation the same way, combined as a geometric mean with equal weights, so that no part dominates and a part at zero does not zero the whole. Each card shows its parts with their figures and their own indexes, so that a reader can see which part is pulling.
The indexes are modeled from published statistics applied to the area. They are not observed spending or behavior, and the tab says so under its question.
Social vulnerability is the one exception to the scaling. It is shown as the CDC's own percentile of US census tracts, with the nation's percentile beside it, because that is the scale the CDC publishes and the one its users know. Higher means more vulnerable.
The summary table
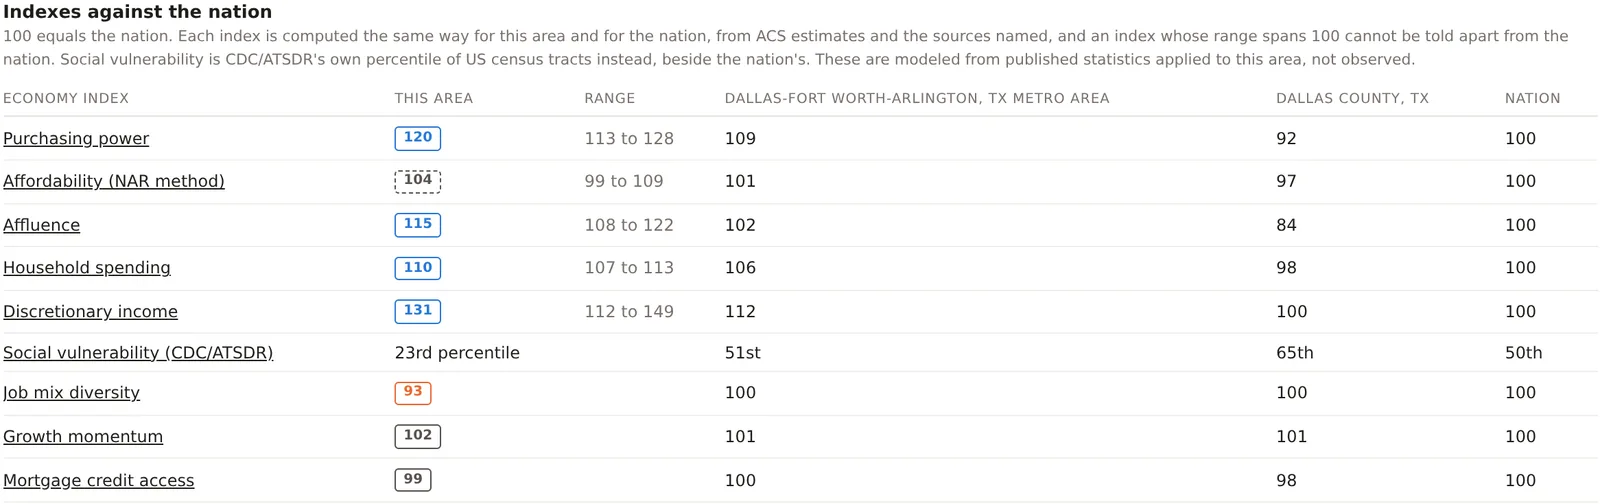
The card headed Indexes against the nation lists every index with four columns. This area is the index for the combined footprint, as a chip. Range is the index's likely range, from the margins of error on the survey figures it is built from, so an index of 120 with a range of 113 to 128 would read between those two nine times in ten if the survey were repeated. An index whose range includes 100 is drawn as a dashed chip and reads as level with the nation, because the difference is too small to call given the margin. An index built from sources that publish no margin, such as the jobs counts, has no range.
The two middle columns are the same index for the metro and the county the area sits in, computed by the same code from the same sources, and the last is the nation at 100. The four sit on one scale, so an area at 120 in a metro at 109 and a county at 92 is a well off neighborhood in a well off market, and a reader who knows the county has the context without leaving the page.
The cards
Below the summary, one card per index gives its parts with their figures and their indexes, a sentence on how it is built, and the source and year. The spending potential card gives dollars by category, and the growth momentum card carries home prices beside it for context. The designations and banking cards are not indexes. They give shares and counts for the area beside the nation's.
Indexes by location
At the foot of the tab, the card headed Indexes by location gives each location's own index on every measure, so that two sites in one project can be compared on purchasing power or affluence in one row each, where the summary table describes the combined footprint.

When an index is withheld
An index is withheld rather than estimated when its inputs are not sound for the area, and the card says why in a sentence. The reasons are of a few kinds. Too few households for an income distribution withholds the spending indexes in a very small area. No complete price level withholds purchasing power where fewer than 99 percent of residents have one. Fewer than a thousand jobs withholds job mix diversity and the jobs part of growth momentum, because one employer would move the mix. Fewer than a hundred decided mortgage applications withholds credit access. Rent or owner costs published for too few homes withholds discretionary income. In each case the figure is absent, never shown as zero.
An example
The Downtown Dallas project on 30 October 2026 read purchasing power 120, affordability 104 drawn dashed, affluence 115, household spending 110, discretionary income 131, social vulnerability at the 23rd percentile, job mix diversity 93, growth momentum 102 and mortgage credit access 99. Read down the metro column, Dallas-Fort Worth-Arlington read 109, 101, 102, 106, 112, 51st, 100, 101 and 100, and down the county column Dallas County read 92, 97, 84, 98, 100, 65th, 100, 101 and 98. The two locations read 130 and 100 on purchasing power and 146 and 93 on discretionary income in the Indexes by location table. The tab's reading of the project is a well paid, young, low-vulnerability downtown that spends freely, leans on a few office industries, and is growing a little faster than the nation, sitting inside a county that reads below the nation on most money measures. Each of the nine pages that follow explains one of those readings.
Things to know
An index describes the area against the nation, and the nation is the whole United States, so a reading of 100 in an expensive coastal metro and 100 in a rural county mean the same thing on the scale and different things to a business.
The indexes rest on the survey figures of the other tabs, and the survey year under the project name applies to them. Jobs, prices, taxes and mortgage applications carry their own years, named on each card.
The chips on the Economy tab compare with the nation. The chips elsewhere on the analysis page compare with the comparison area chosen in the Benchmarks card, usually the metro.
Related pages
The eleven indexes and the spending table each have a page in this part, beginning with Purchasing power. The analysis page explains ranges and chips in general, and the methodology page sets out every index's arithmetic and the regression figures it was checked against.