Purchasing power
What a typical household's income buys once local prices are taken into account, against the nation at 100, built from median household income and the Bureau of Economic Analysis price levels.
What this is for
A dollar does not buy the same thing everywhere. A median household income of $100,000 in Manhattan and the same income in Dallas are two different standards of living, because rent, food and services cost more in one than the other. Purchasing power adjusts an area's median household income by the price level of the place it sits in, so that two areas can be compared on what their typical household can actually buy rather than on the figure printed on the paycheck.
It answers the question a retailer or a lender asks before the income figure, namely how far that income goes here.
Where to find it
On the Economy tab of the analysis page, the first row of the summary table and the first card below it, headed Purchasing power. The section link under the tab's question jumps to it. The Economy tab is part of the Pro and Team plans.
How it is built
The index is the area's median household income divided by its price level, set against the nation's median household income at the nation's price level, times 100. The price level is the Bureau of Economic Analysis Regional Price Parity, a figure for every metropolitan area and for the nonmetropolitan part of every state, with the nation at 100. A county inside a metro takes its metro's parity and any other county takes its state's nonmetropolitan parity, and an area's price level is the parity of each county it covers, weighted by the residents the area holds in each, from the newest parity year at or before the survey year.
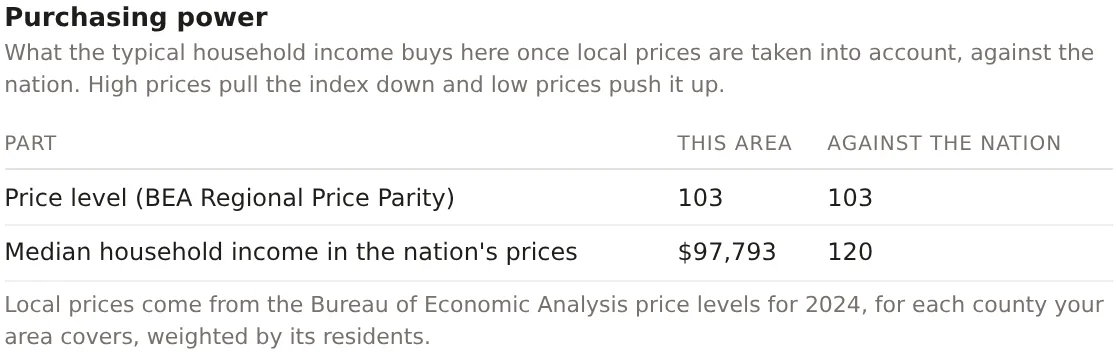
The card shows two parts. Price level gives the area's parity, with the nation at 100. Median household income in the nation's prices gives the median income divided by that price level, in dollars, and its index against the nation, which is the purchasing power index itself. The sentence beneath names the parity year and says that a county's price level is applied to the whole area.
Reading the results
An index of 100 means the typical household here can buy what the typical household in the nation can. Above 100 is more buying power and below 100 is less. The range beside the index in the summary table comes from the margin of error on median household income, since the price level is a published figure with no margin, and an index whose range includes 100 is drawn dashed and is level with the nation.
The metro and county columns of the summary table are the same index for the metro and the county the area sits in, so the three read on one scale. An area at 120 inside a metro at 109 is a well off neighborhood of a somewhat well off market.
An example
The Downtown Dallas project on 30 October 2026 read a price level of 103, so prices there run 3 percent above the nation, and a median household income in the nation's prices of $97,793, an index of 120 with a range of 113 to 128. The Dallas-Fort Worth-Arlington metro read 109 and Dallas County 92. The reading says that downtown households have a fifth more buying power than the typical American household, in a metro with a tenth more, and a county with a twelfth less. The county's 92 is the figure that places the downtown among its neighbors.
Things to know
The price level is one figure for a whole metro, so within a metro the index follows income alone. It overstates purchasing power in a neighborhood that is dearer than its metro, Manhattan inside the New York metro being the clearest case, and understates it in a cheaper one.
The index is withheld rather than estimated when fewer than 99 percent of an area's residents have a price level, which happens at the edge of the data rather than in ordinary use.
Purchasing power describes the typical household. Affluence describes wealth and Discretionary income describes what is left after housing and taxes, which are different questions with different answers for the same area.
Related pages
The Economy tab explains the summary table and how every index reads. Affordability is the next card. The methodology page sets out the arithmetic and the parity rules.