Affluence
A stand-in for wealth, which no survey publishes for areas this small, built from median home value, the share of households with investment income and the share earning $200,000 or more, against the nation at 100.
What this is for
Income says what a household earns this year. Wealth says what it has, and for a business that sells cars, jewelry, financial advice or second homes, wealth is the better guide. No survey publishes wealth for an area the size of a neighborhood, so the affluence index stands in for it with three figures the American Community Survey does publish and that move with wealth, namely the value of the homes people own, how many households have income from investments, and how many earn in the top bracket.
Where to find it
On the Economy tab, the third row of the summary table and the card headed Affluence. Part of the Pro and Team plans.
How it is built
The index is the equal-weight geometric mean of three measures, each set against the nation.
Median home value, of owner-occupied homes, which is the largest asset most households hold.
Households with interest, dividends or net rental income, as a share of households, which is the share with investments that pay.
Households with income of $200,000 or more, as a share of households, which is the top income bracket the survey publishes.
All three are required, so a small area without a median home value gets no affluence index rather than one built from two parts. Inside the mean a part below 1 counts as 1, so an area with almost no top-bracket households does not drag the index toward zero. The range comes from the three parts' margins, treated as independent.
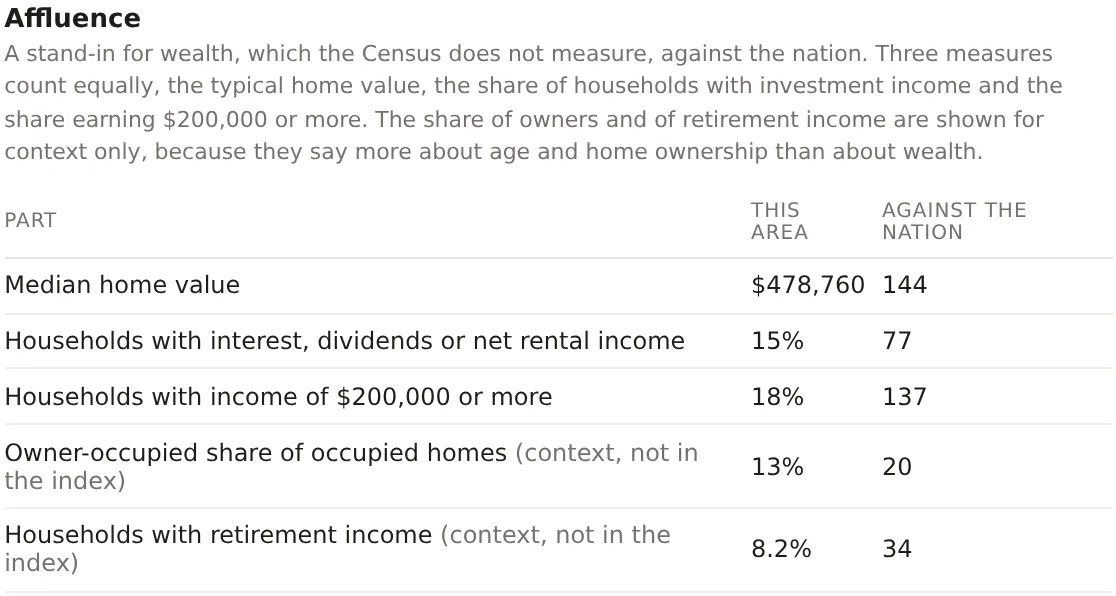
Two more figures are shown on the card for context and kept out of the mean, namely the owner-occupied share of occupied homes and the share of households with retirement income. They say more about the age and tenure of an area's households than about its money. A downtown of young renters with high incomes would otherwise read like a much poorer neighborhood.
Reading the results
Above 100 is wealthier than the nation and below 100 less so. The spread is wide, because wealth is concentrated. Marin County, California reads above 300 and a poor rural county can read under 40, where most indexes stay within a few tens of 100. Each part is shown with its figure and its own index, so that a reader can see whether an area is affluent through its homes, its investments or its earners.
An example
The Downtown Dallas project on 30 October 2026 read 115 with a range of 108 to 122. Its median home value of $478,760 read 144 against the nation, 15 percent of its households had interest, dividend or rental income, an index of 77, and 18 percent earned $200,000 or more, an index of 137. The two context lines read 13 percent owner-occupied, an index of 20, and 8.2 percent with retirement income, an index of 34, which is why they are kept out of the mean. Dallas County read 84 and the metro 102. The reading says a downtown of highly paid renters in expensive buildings, affluent on earnings and homes and not yet on investments, which is what a young professional neighborhood looks like.
Things to know
The index is a stand-in. It follows wealth where the three parts follow it, and a retirement community of modest homes and large portfolios can read lower than its residents' balance sheets would.
Home value is the owners' own estimate, as the survey asks it.
The share with investment income counts any amount, so an area of many small savers and an area of few large ones can read alike on that part.
Related pages
Affordability comes before this card and Household spending after. Purchasing power describes income rather than wealth. The methodology page gives the arithmetic and the regression figures for several counties.