Affordability
How far typical incomes go toward buying the median home or renting, by the National Association of Realtors' method, against the nation at 100, with the three parts and the role of the mortgage rate explained.
What this is for
Affordability asks whether the people who live in an area can afford to live there. It matters to a business because an area where housing takes most of a household's income has less to spend on anything else, and because a market whose housing is out of reach for its own residents is one whose residents will change. The index puts the question on one scale with the nation at 100, so that a downtown and a suburb can be compared without reading three housing figures apart.
Where to find it
On the Economy tab, the second row of the summary table and the card headed Affordability (NAR method). Part of the Pro and Team plans.
How it is built
The index is the equal-weight geometric mean of three measures, each set against the nation.
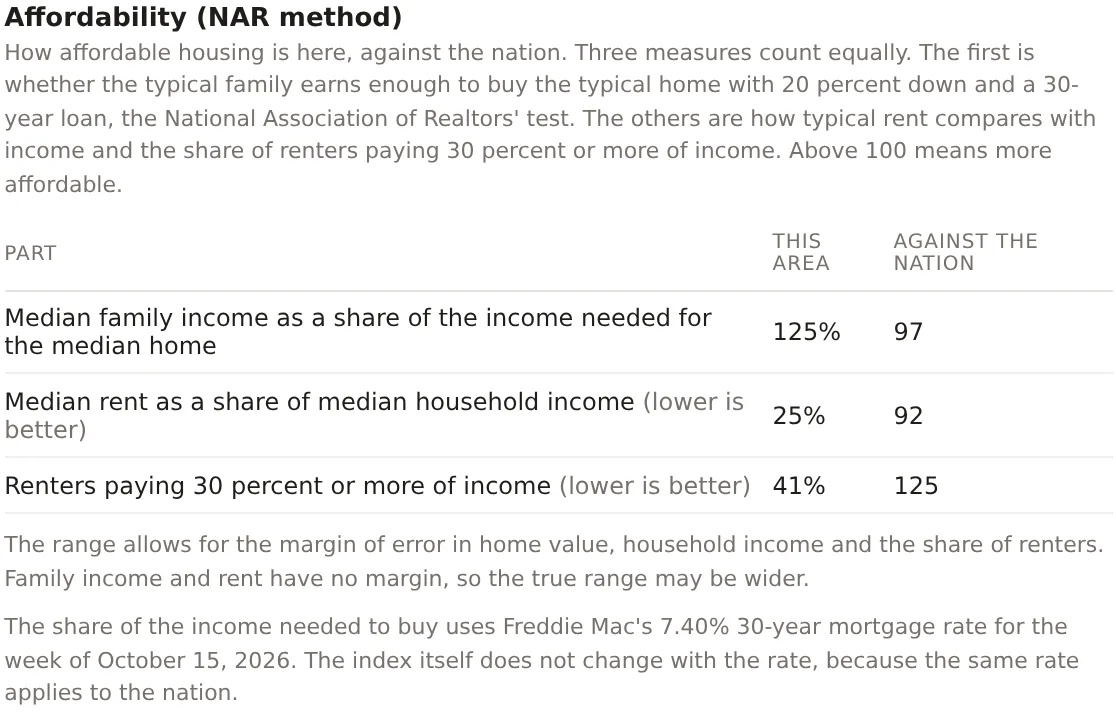
Median family income as a share of the income needed for the median home. This is the National Association of Realtors' housing affordability method. It takes the median home value, assumes 20 percent down and a 30-year fixed loan at the current rate, works out the income at which the payment would be a quarter of income, and compares the area's median family income with it. A share of 125 percent means the typical family earns a quarter more than it would need. The payment uses Freddie Mac's newest weekly mortgage rate, which the card names.
Median rent as a share of median household income. Twelve months of the median gross rent against median household income, inverted so that a smaller share reads as more affordable.
Renters paying 30 percent or more of income. The share of renter households that are cost burdened by the usual definition, inverted the same way.
The mortgage rate cancels out of the index, because the payment is proportional to the loan at any given rate on both sides of the comparison. It is used only for the plain-language share of needed income in the first part, so the index does not move when rates do, and the card says so.
Reading the results
Above 100 means housing is more affordable for the area's own residents than for the nation's, and below 100 less. Each part is shown with its figure and its index against the nation, so that a reader can see which of the three is pulling. An area can read above 100 on owning because its families earn well and below 100 on rent burden because its renters do not, and the card shows both.
The range comes from the margins of error on home value, household income and the renter share. Median family income and median rent are blends of published medians with no margin, so the true range may be wider, and the card says so. An index whose range includes 100 is drawn dashed and reads as level with the nation.
An example
The Downtown Dallas project on 30 October 2026 read 104 with a range of 99 to 109, drawn dashed because the range includes 100. Its families earned 125 percent of the income needed for the median home, an index of 97 against the nation, so owning is slightly less within reach than nationally, because the median home value of $478,760 is high. Median rent took 25 percent of median household income, an index of 92, and 41 percent of renters paid 30 percent or more, an index of 125, better than the nation's share. The payment used Freddie Mac's 7.40 percent rate for the week of 15 October 2026. The metro read 101 and the county 97. The reading says that downtown Dallas is about as affordable for its own residents as the nation is for its residents, with the renters doing better than the would-be owners.
Things to know
The index describes the area's housing against the area's own incomes. A cheap neighborhood of poor households and a dear neighborhood of rich households can both read 100.
The first part needs a median home value, which a small area with few owner-occupied homes may not have, and the index is then withheld rather than built from two parts.
The method follows the National Association of Realtors so that the figure is comparable with the affordability indexes the industry publishes, which use the same assumptions of 20 percent down and a quarter of income.
Related pages
Purchasing power comes before this card and Affluence after. The Income & Housing tab holds the home values, rents and rent burden the index is built from. The methodology page gives the arithmetic.