Household spending
What households in an area spend in a year, overall and in nine broad categories, against the nation at 100, modeled from what households at each income and householder age spend nationally.
What this is for
Income is what comes in. Spending is what goes out, and for a retailer it is the figure that matters, because a market is the sum of what its households spend on what the retailer sells. No survey measures spending for an area the size of a neighborhood, so the product models it. It takes what households at each income level and each householder age spend nationally, from the Bureau of Labor Statistics' Consumer Expenditure Survey, and applies those figures to the mix of incomes and ages actually living in the area.
The result is an estimate of what the area's households would spend at national habits. It is not a record of what anyone was seen to spend, and the card says so.
Where to find it
On the Economy tab, the fourth row of the summary table and the card headed Household spending. Part of the Pro and Team plans.
How it is built
The Consumer Expenditure Survey publishes mean yearly spending for nine ranges of income before taxes, overall and by category. Those means are too noisy on the narrow categories to apply as they stand, so each category's spending is fitted as a smooth curve against income, weighted by the survey's own standard errors and scaled so that the national mean is reproduced exactly. The householder's age enters as one factor per category and age group, from the survey's tables of age by income, so that a retirement community and a young suburb with the same incomes read differently where the survey finds that they spend differently.
An area's spending per household is then its households in each cell of householder age by income bracket, from the Income by age of householder table on the Income & Housing tab, times the curve at the bracket's income and the age factor. The index is total spending per household against the nation's, and each of nine categories beside it is its own index, namely food at home, food away from home, housing, apparel and services, transportation, health care, entertainment, personal care products and services, and education.
The range comes from the cells' margins of error. The survey's own sampling error is the same on both sides of the comparison and is left out.
Reading the results
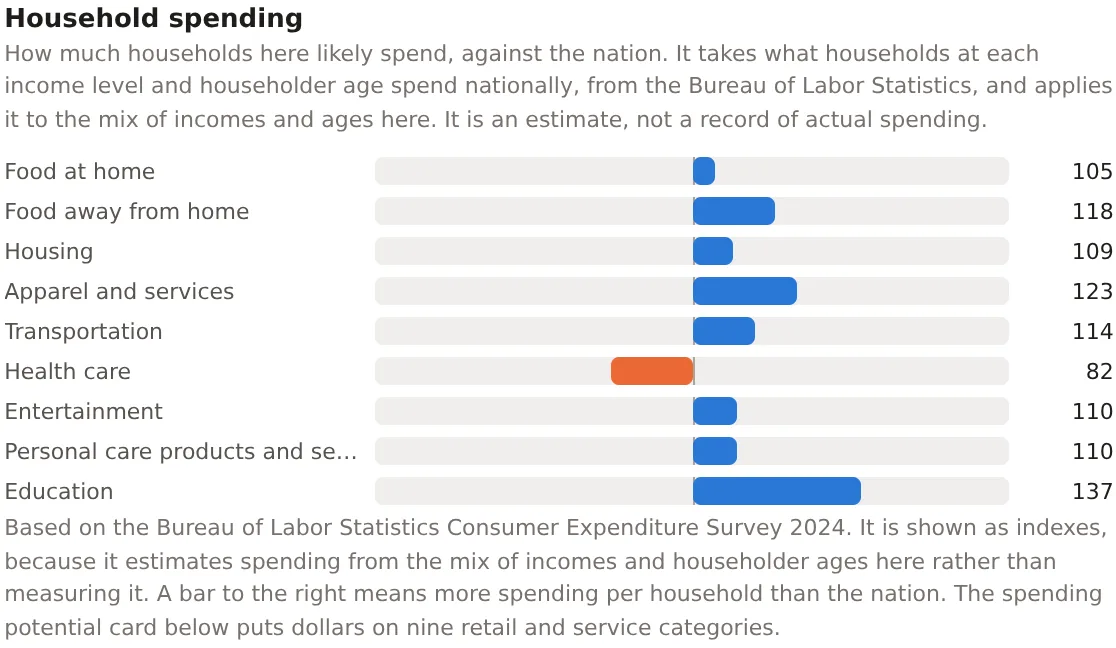
The summary table's figure is total spending per household against the nation. The card's bars are the categories, each with its index, drawn to the right of 100 where the area's households spend more per household than the nation's and to the left where they spend less. Because spending rises with income less than proportionally, an area with twice the nation's income does not read 200 on spending, and because the categories respond to income differently, an affluent area reads far above the nation on education and entertainment and only a little above it on food at home.
Health care is the category that most often reads below 100 in a young area and above it in an old one, because the age factors carry the survey's finding that older households spend more on it. That is the age factor at work, and it is the reason the model uses age.
An example
The Downtown Dallas project on 30 October 2026 read 110 overall with a range of 107 to 113, against 106 for the metro and 98 for Dallas County. Its categories read food at home 105, food away from home 118, housing 109, apparel 123, transportation 114, health care 82, entertainment 110, personal care 110 and education 137. The pattern is a young, well paid downtown, spending a quarter more than the nation on clothes and a third more on education and a fifth less on health care, with groceries close to the nation because food at home rises slowly with income. Spending potential turns the same model into dollars for nine retail categories.
Things to know
The model describes households at national habits. An area whose residents spend differently from other Americans of the same income and age, for reasons the survey does not see, reads as if they did not.
A check of the model against the survey's own figures for the twenty-two largest metros found it within about 4 percent on total spending for the median metro. The region of residence was left out of the model because adding it carried regional price levels into a model meant to work in national prices, and the age factors were kept by decision, since the metros share the nation's age mix and the check could not test them. The methodology page says so and gives the figures.
The index needs the householder age by income table, so an area too small for one reads Too few households for an income distribution rather than an index.
Related pages
Affluence comes before this card and Spending potential after, which shows the same model in dollars by retail category. Discretionary income reads the model's essentials. The methodology page gives the fit, the check and the decision.