Discretionary income
What a typical household has left after taxes, housing and the essentials, in the nation's prices, against the nation at 100, with the four parts and the tax model explained.
What this is for
A household's income is not what it has to spend. Taxes take a share first, then rent or the mortgage, then food, getting to work and health care, and what is left is what a restaurant, a gym or a furniture store competes for. Discretionary income is that remainder, estimated for an area's typical household and set against the nation's at 100. Two areas with the same income can read very differently on it, because one pays twice the rent, and that difference is what a business selling anything optional needs to know.
Where to find it
On the Economy tab, the fifth row of the summary table and the card headed Discretionary income. Part of the Pro and Team plans.
How it is built
The index starts from the area's own aggregate household income and takes four steps, each shown as a part on the card.
After-tax income per household. Taxes come from PolicyEngine, the open-source successor to the tax model the Bureau of Labor Statistics used until it stopped publishing after-tax income with its 2024 tables. For every state, PolicyEngine computes the federal income, state income and payroll taxes on the survey's average household in each income range, and for the highest range also on the average return the IRS reports above $500,000 and above $1 million, with its mix of capital gains, business income and deductions. The area keeps the share of income those taxes leave, weighted by its residents in each state and read at its own average income in the top bracket. The card shows this share as its own part, Share of income left after federal, state and payroll taxes, beside the after-tax income.
Rent and owner costs per household. The area's rent and owner costs, which include utilities, from the survey's aggregate rent and owner cost tables, scaled to all of its homes because the Census Bureau withholds the total for about a sixth of block groups. Lower is better, and the index is withheld where fewer than half of an area's renter or owner homes have a published cost.
Food at home, transportation and health care per household, at local prices. The household spending model's essentials, at the area's price levels for goods and services. Lower is better.
What is left is divided by the area's price level, so that the result is in the nation's prices, and reads zero where housing and essentials take everything after taxes. The index is that remainder against the nation's.
Reading the results
Above 100 means more left over than the nation's typical household and below 100 less. The spread is wide, because the remainder is the difference between two large figures. A poor area can read in the thirties, and a rich suburb above 150. The parts explain the reading. An area high on after-tax income and low on housing cost reads very high, and an area with the same income and twice the housing cost reads far lower, which is the comparison between a well paid suburb and a well paid downtown.
The dollar figures for the parts are shown as index only on the card, because the after-tax and essentials parts are modeled rather than published figures, and only their indexes against the nation are meaningful.
An example
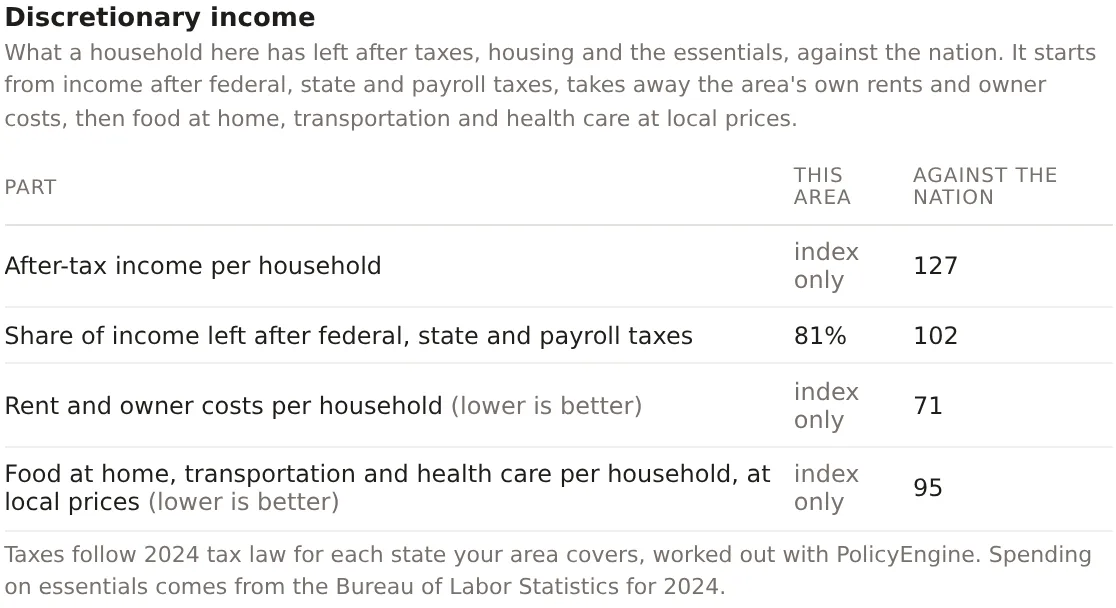
The Downtown Dallas project on 30 October 2026 read 131 with a range of 112 to 149, against 112 for the metro and 100 for Dallas County. Its after-tax income per household read 127 against the nation, its households kept 81 percent of income after taxes, an index of 102, its rent and owner costs per household read 71, lower being better, and its essentials at local prices read 95. The reading says downtown households earn a quarter more after taxes than the nation's typical household and pay less for housing per household than the nation does, because most are one-person households in rented apartments, so that they have about a third more left over. Taxes followed 2024 law for Texas, which has no state income tax, and the essentials came from the survey for 2024.
Things to know
The index describes the typical household, built from the area's aggregate figures, not any one household.
Housing costs are per household, so an area of one-person apartments reads lower housing costs than an area of family houses even when the rent per square foot is higher, and that is the correct reading of what each household has left.
The tax model follows each state's law for the year named on the card, and an area spanning two states takes each state's share by its residents.
Related pages
Spending potential comes before this card and Social vulnerability after. Purchasing power adjusts income for prices without taking housing out, which is the difference between the two. The methodology page gives the tax model and the housing cost rules.