Social vulnerability
How much an area's social and economic conditions leave its residents exposed to harm from a disaster or a hardship, by the CDC's measure, shown as a percentile of every US census tract with three of the CDC's four themes beside it.
What this is for
Social vulnerability is the Centers for Disease Control and Prevention's measure of how well the people of a place could weather a disaster or a hardship, built from sixteen census measures of poverty, unemployment, housing cost, education, age, disability, language, crowding, vehicle access and the like. Public health agencies use it to plan where help is needed first. A business reads it as a measure of need and exposure in a market, which bears on what to sell, how to price it and what a downturn would do to the area, and a lender or a public agency reads it directly.
The product shows the CDC's figure as the CDC publishes it, so that it can be compared with the CDC's own maps and with other tools that use it.
Where to find it
On the Economy tab, the sixth row of the summary table and the card headed Social vulnerability (CDC/ATSDR). Part of the Pro and Team plans.
How it is built
The CDC ranks every US census tract on each of sixteen measures, sums the rankings within four themes and overall, and publishes each tract's percentile among all US tracts, from 0 to 100, with higher meaning more vulnerable. The product takes the tracts an area covers, weights each tract's summed score by the residents the area holds in it, and places the result among all US tracts by the CDC's own percentile rule, so that an area that is exactly one tract reads that tract's published percentile.
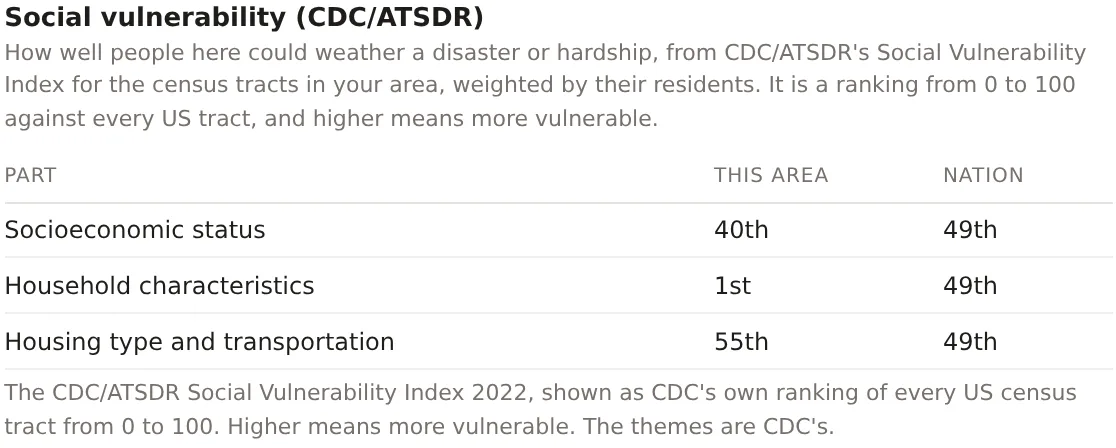
The card shows the overall percentile and three of the CDC's four themes beside it, namely socioeconomic status, household characteristics, and housing type and transportation, each as a percentile for the area and for the nation. The CDC's fourth theme, racial and ethnic minority status, is not shown. The overall percentile is the CDC's own as published, and the CDC counts minority status as one of its sixteen measures within it.
The nation's figure is the same weighted score over every US tract, which reads near the 50th percentile. The CDC publishes no margin for its scores, so the figure has no range.
Reading the results
The figure is a percentile, not an index. The 23rd percentile means the area is less vulnerable than 77 percent of US census tracts, and the 95th means more vulnerable than 95 percent. The summary table gives the metro's and the county's percentiles beside it on the same scale, and the nation's.
The themes say where the vulnerability lies. An area at the 40th percentile on socioeconomic status and the 1st on household characteristics has modest incomes and almost no residents who are old, young, disabled or living alone with children, which is a young singles' district. The same overall figure made of the opposite themes would be an old and poor one.
An example
The Downtown Dallas project on 30 October 2026 read the 23rd percentile overall, against the 51st for the Dallas-Fort Worth-Arlington metro, the 65th for Dallas County and the 50th for the nation. Its themes read socioeconomic status at the 40th, household characteristics at the 1st, and housing type and transportation at the 55th, against the 49th for each nationally. The reading is a downtown with almost no vulnerable households by composition, somewhat above the nation on crowding and vehicle access because it is dense and many residents have no car, and well below the county around it.
Things to know
The CDC could not score 778 tracts in its 2022 release, 503 of them with no residents, and those are left out. The figure is withheld where they hold more than half of an area's residents.
The index describes need and exposure in an area as a whole, from census measures. It says nothing about the people who live there one by one, and the product never reads the CDC's minority status theme.
The CDC releases the index every two years, and the card names the release.
Related pages
Discretionary income comes before this card and Job mix diversity after. The People tab and The Income & Housing tab hold the census measures the CDC's themes are built from. The methodology page gives the weighting and the percentile rule.