Spending potential
What the residents of an area spend each year in nine retail and service categories, as dollars per household, a yearly total, a share of all spending, dollars per square kilometer and an index against the nation, with child care allocated by the children who have working parents.
What this is for
Spending potential is the household spending model shown in dollars, for the nine categories a retail or service business most often asks about. It says how much the residents of an area spend in a year on groceries, on dining out, on their pets, and so on, as a figure per household, as a total for the area, as a share of everything they spend, as dollars per square kilometer, and as an index against the nation. It is the figure that sizes a market in a sentence, such as "the households within ten minutes spend $202 million a year on groceries".
The dollars are estimates of what residents spend wherever they shop, in the survey year's prices, with no local price adjustment. They are not what businesses in the area take in, since residents buy online and elsewhere and visitors and workers spend in the area too.
Where to find it
On the Economy tab, the card headed Spending potential, after Household spending. Part of the Pro and Team plans. The indexes also appear in All Data and the CSV export, and the dollars in the CSV and the PDF report.
The categories
| Category | What it holds |
|---|---|
| Groceries | Food at home |
| Dining out and takeout | Food away from home. Alcohol is left out, since the survey does not split restaurant alcohol from store alcohol |
| Furniture and appliances | Furniture, major appliances, small appliances and housewares |
| Household services | Housekeeping, gardening and lawn care, moving, appliance repair and similar services |
| Childcare | Babysitting, child care, day care and preschool |
| Vehicle maintenance | Maintenance and repairs |
| Personal care | Personal care products and services |
| Recreation | Fees and admissions, and other entertainment supplies and services |
| Pets | Pets, pet supplies and veterinary services |
How it is built
Each category's dollars come from the same model as Household spending, the survey's spending at each income and householder age applied to the area's households, and are then calibrated so that the nation's modeled total equals the survey's own national aggregate for the category. The calibration is small, within about 3 percent by category, because two gaps nearly cancel. The survey counts about five percent more consumer units than the Census counts households, since one household can hold several financially separate units, while the Census income mix is somewhat richer than the survey's.
Per household is the modeled spending per household. The index is that figure against the nation's at 100, and the metro and county columns are the same index for the metro and the county. A year, all residents is per household times the area's households. Share of spending is the category's part of the area's modeled spending on everything. Per km² is the yearly total over the area as drawn, water included, as every density in the product is measured.
Child care is allocated rather than modeled. The survey's national total for babysitting, child care, day care and preschool goes to areas in proportion to their children under six whose parents are all in the labor force, with each block group's count weighted by the survey's own child care spending per child at the block group's mean household income. That gradient is steep, since the survey finds households at $200,000 and above spending about four times what households under $50,000 spend on paid care per child, so an affluent suburb reads well above its share of children and a low-income area well below it. An area with no such children reads zero, and an area whose children figure is not loaded reads nothing rather than zero.
Reading the results
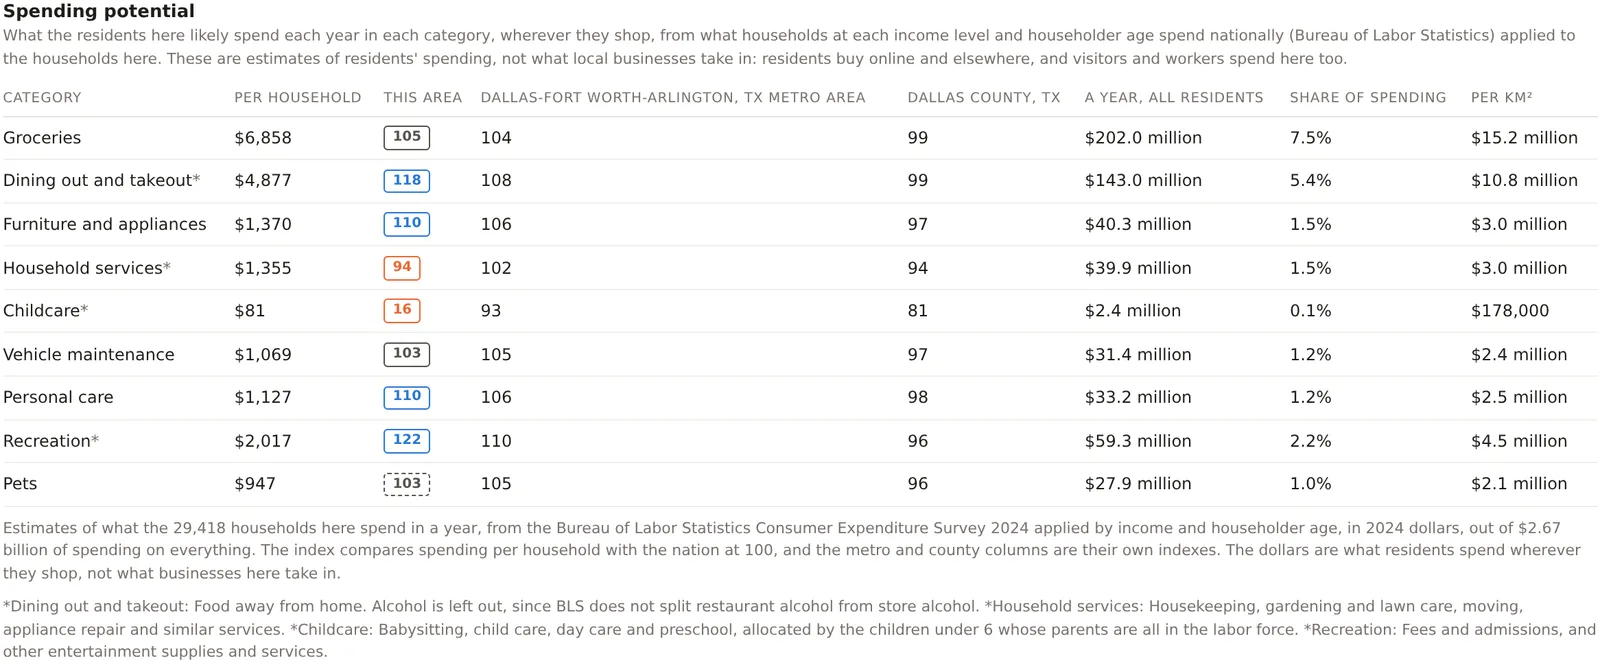
Read the index first, because it says whether the area's households spend more or less than the nation's on the category, and read the dollars second, because they say how much the market is worth. An index of 118 on dining out with a yearly total of $143 million says a market that eats out more than most and is worth $143 million a year to restaurants, which is the figure a restaurant group wants. The share column says what part of the household budget the category takes, which is steadier across areas than the dollars and is how a category's weight in a market is read.
The index is per household, so it does not grow with the area. The yearly total does, and the per square kilometer figure says how concentrated the spending is, which is what a store serving a walk-in trade wants.
An index drawn dashed is within its margin of the nation. The households and the total of all spending appear in the sentence beneath the table, with the survey year and the dollars' year.
An example
The Downtown Dallas project on 30 October 2026 read, for 29,418 households spending $2.67 billion a year on everything, groceries $6,858 per household at an index of 105, $202 million a year and 7.5 percent of spending; dining out $4,877 at 118 and $143 million; furniture and appliances $1,370 at 110; household services $1,355 at 94; child care $81 at 16; vehicle maintenance $1,069 at 103; personal care $1,127 at 110; recreation $2,017 at 122 and $59 million; and pets $947 at 103, drawn dashed. The child care index of 16 is the striking one. Only 4 percent of downtown households have children, so the area's share of child care spending is a sixth of the nation's per household, however well paid the households are. A day care operator reads that card and looks elsewhere, which is the point of showing child care beside the rest.
Things to know
The dollars are residents' spending at national habits in the survey year's prices. They are not sales, and a store's capture of them depends on competition, online shopping and the daytime population, which the Businesses and Work & Movement tabs describe.
The categories are the survey's lines, and the card's footnotes say what each holds. Dining out leaves out alcohol because the survey cannot split it.
The index and the dollars rest on the same householder age by income table as household spending, and an area too small for one reads nothing.
Related pages
Household spending is the model behind these dollars. Discretionary income is next. The Businesses tab says who is already serving the spending, and the methodology page gives the calibration and the child care allocation.