Guide
Compare the businesses around a potential site
A practical guide from MarketGround
Review the businesses in the same area you use to analyze potential customers. This guide shows how to compare categories, brands and business density using examples from Northern Virginia and Dallas.
The method
Choose the area and relevant business categories
Define the area using the travel time or distance appropriate to your location. Select the business categories that relate to your offer, such as coffee shops, hair salons or pharmacies. Use the same area when reviewing the surrounding population.
Compare business density and the surrounding mix
Calculate residents or estimated daytime population per listed business to compare areas of different sizes. Review the brands and other nearby businesses to understand the local mix. Use these results to prepare for a site visit and a closer review of the businesses relevant to your concept.
Worked example one
Coffee in four Northern Virginia centers
The table compares coffee shops and restaurants within the same two-kilometer radius around four employment centers. It also shows estimated daytime population per listed coffee shop, providing a common measure across the areas.
| Two kilometers around | Daytime population | Coffee shops | Daytime people per coffee shop | Restaurants | Eating and drinking places |
|---|---|---|---|---|---|
| Tysons Corner | 110,559 | 26 | 4,252 | 52 | 357 |
| Reston Town Center | 68,951 | 17 | 4,056 | 40 | 248 |
| Dulles Town Center | 24,223 | 11 | 2,202 | 26 | 204 |
| Data center corridor, Ashburn | 15,685 | 1 | 15,685 | 10 | 64 |
Swipe the table sideways to see every column.
Business categories come from Overture Maps, and daytime figures are MarketGround estimates. Source details are on the methodology page.
Tysons and Reston each have roughly one listed coffee shop per 4,000 people in their daytime estimates. Dulles Town Center has one per 2,202, while the Ashburn area has one per 15,685. Compare these ratios with the size, layout and business mix of each area when evaluating a location.
Worked example two
Hair salons across three Dallas suburbs
Three miles around three suburban centers, with the residents divided by the salons already listed there. Legacy West and Firewheel have almost the same number of residents.
| Three miles around | Residents | Hair salons | Residents per salon |
|---|---|---|---|
| Legacy West, Plano | 99,809 | 202 | 494 |
| Firewheel, Garland | 99,529 | 40 | 2,488 |
| Uptown Village, Cedar Hill | 48,152 | 39 | 1,235 |
Swipe the table sideways to see every column.
The table compares residents and listed salons within the same radius around each site.
Legacy West has about five times as many listed salons as Firewheel, with a similar resident population. Legacy West also has higher household income and a larger daytime estimate. Reviewing these measures together gives a more complete comparison of the two areas.
Reading the brands
Review the brands behind the location count
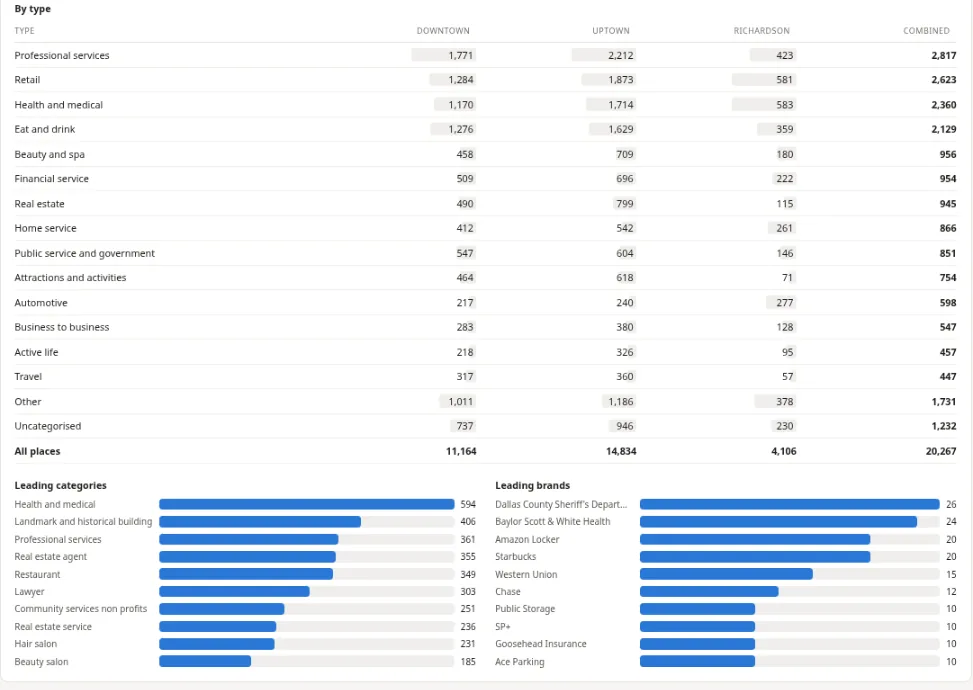
The brand list helps you distinguish multiple outlets of the same brand from a mix of different brands and independent businesses. Use that information to examine the specific businesses relevant to your site.
The same list finds the businesses worth being near. Within a ten-minute walk of Deep Ellum in Dallas there are 181 places selling food and drink and 31 of them are restaurants. The same walk at Legacy West in Plano gives 95 and 21, and in the Lakewood neighborhood it gives 37 and six.
The rest of a retail site studyQuestions
Questions people ask
Where does the competitor data come from?
Overture Maps, the open map data used by several of the largest mapping products in the world, refreshed monthly. Every listed place inside the shape is counted, grouped through Overture's own taxonomy, so a category means what Overture means by it rather than what a keyword guessed.
How many competitors is too many?
Compare the relevant business count with the surrounding population, then review the local brands and site conditions. Population per listed business gives you a consistent measure for comparing markets.
Does it tell me what competitors earn?
No. Revenue by location is not public. What you get is how many businesses there are, of what category, under which brands, and how many residents or daytime people sit behind each one.
Can I see competitors for a whole city or ZIP?
Yes. Any shape works, including a named boundary such as a ZIP area, a city, a county or a metro area analyzed as itself.
How current is the list?
Business listings are refreshed monthly. MarketGround records the source release for each capture. The methodology page gives the data periods and update details.
More analysis
Related research
Explore related studies and practical guides. Each article presents a geographic comparison and links to the methods behind it.
Compare daytime population, jobs and listed businesses within the same radius around four Northern Virginia employment centers.
Compare ten-minute driving areas and similarly sized circles around four locations.
Explore how household income varies within one Virginia ZIP area and compare two smaller site areas.
Review businesses around your own site
Draw the area, select the relevant categories and compare business counts with the surrounding population. Use the results to focus your review of potential locations.