Trend and history
How an area's population has changed since 2016 and where its counties are heading, with the two sources behind the population chart, the night and day toggle, how to read a change, and the county momentum figures from the Census Bureau and the IRS.
What this is for
A figure for today says what a market is. A trend says what it is becoming, which for a lease of ten years matters more. The Population over time section on the Overview charts the combined footprint's population by year from 2016, and the County momentum section beneath it says whether the counties the area sits in are gaining or losing people and, on the paid plans, income. This page explains both, because each has a wrinkle that a reader should know before quoting it.
Where to find it
Both sections are on the Overview tab of the analysis page, under the Benchmarks card. Population over time is included in every plan. County momentum's Census figures are included in every plan, and its IRS movers figures are part of the Pro and Team plans. The map's Night pop and Day pop layers show the same population surface year by year, which The map describes.
Population over time
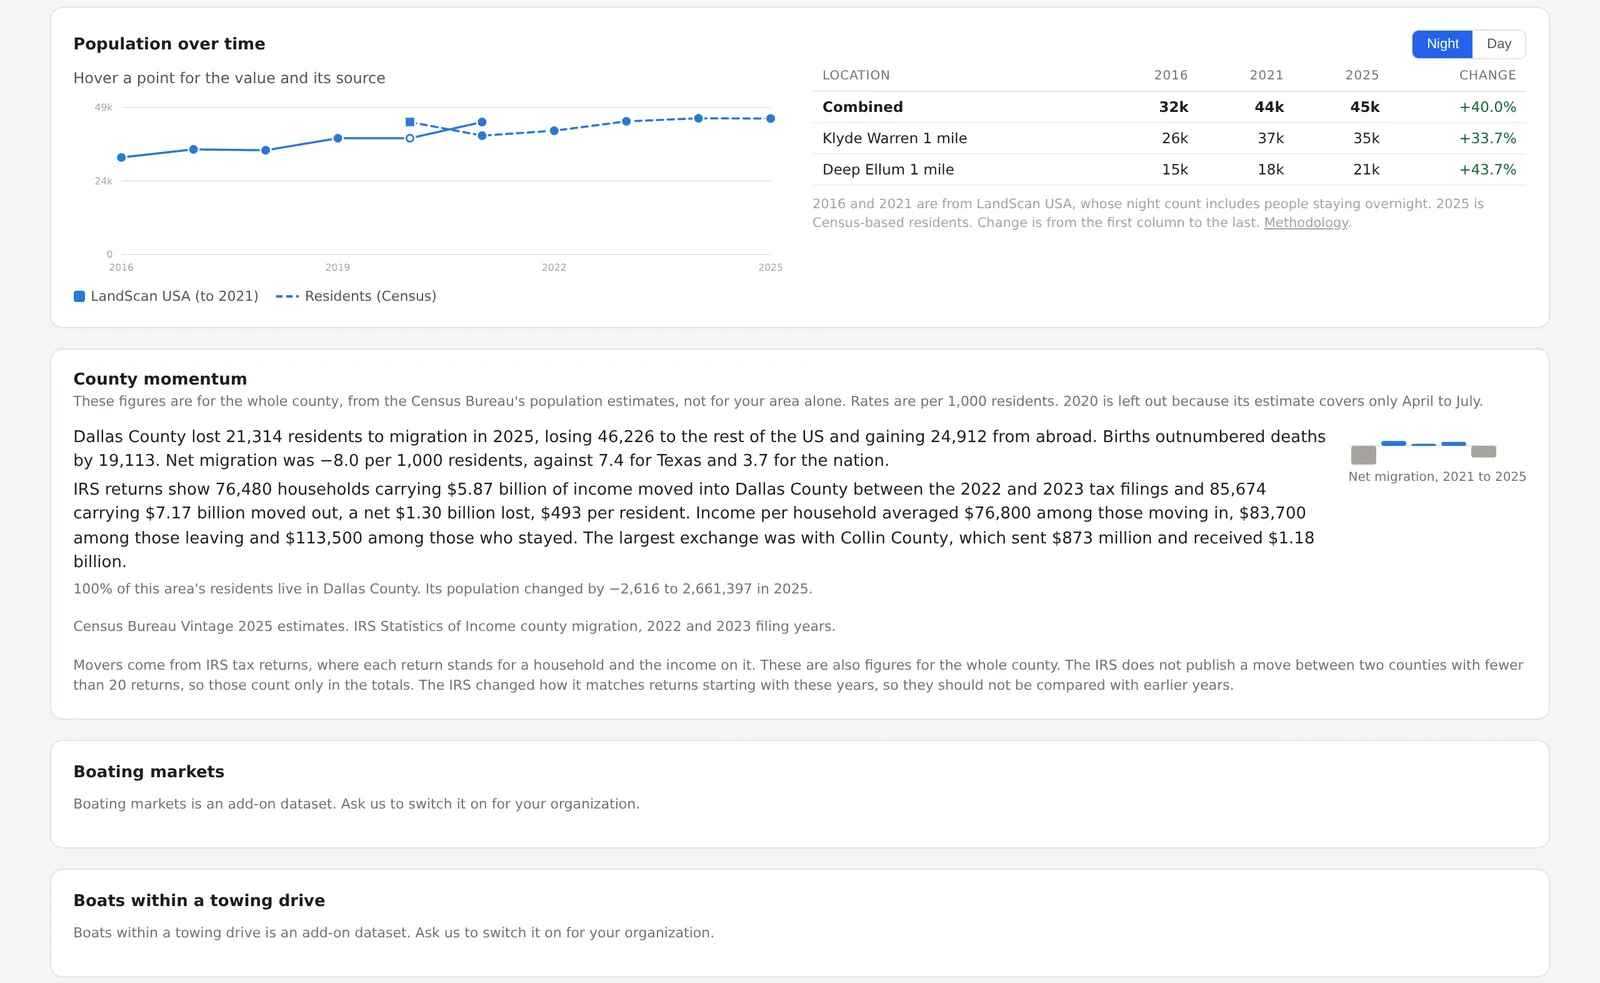
The chart draws the combined footprint's population for each year from 2016 to the newest estimate, with a table beside it giving each location's figure for the first, middle and last years and the change from first to last. The Night and Day buttons switch between where people sleep and where they are during the working day.
The series comes from two sources, which the chart keeps apart. From 2016 through 2021 it is LandScan USA, a modeled surface from Oak Ridge National Laboratory whose night figure counts everyone present overnight, visitors included. From 2020 onward it is a Census-based series that starts from the 2020 count by block and is carried forward by the Bureau's annual county and city estimates, which counts residents. The two overlap in 2020 and 2021, and the chart draws both so that the step between them can be seen rather than mistaken for growth. Two LandScan years, 2019 and 2020, are the same release, so the repeat is drawn hollow, and the 2020 census count is drawn as a square because it is a count rather than an estimate. Hover a point for its value and its source.
Reading a change
The change column in the table is from the first column to the last, so it spans the two sources. For most areas the two agree closely in their overlapping years and the change is a fair reading. For an area where they differ, a downtown with many hotel guests, say, where LandScan's night figure includes visitors and the Census series does not, read the change within one series instead, by hovering the points.
Growth in the Census-based series is placed by city, not within it. The Bureau estimates each county's total and each city's share of it, and the product spreads a city's growth over the city's blocks in proportion to what was there in 2020. A newly built edge of a growing suburb can therefore read low while the city as a whole is right, and the methodology page says so.
County momentum
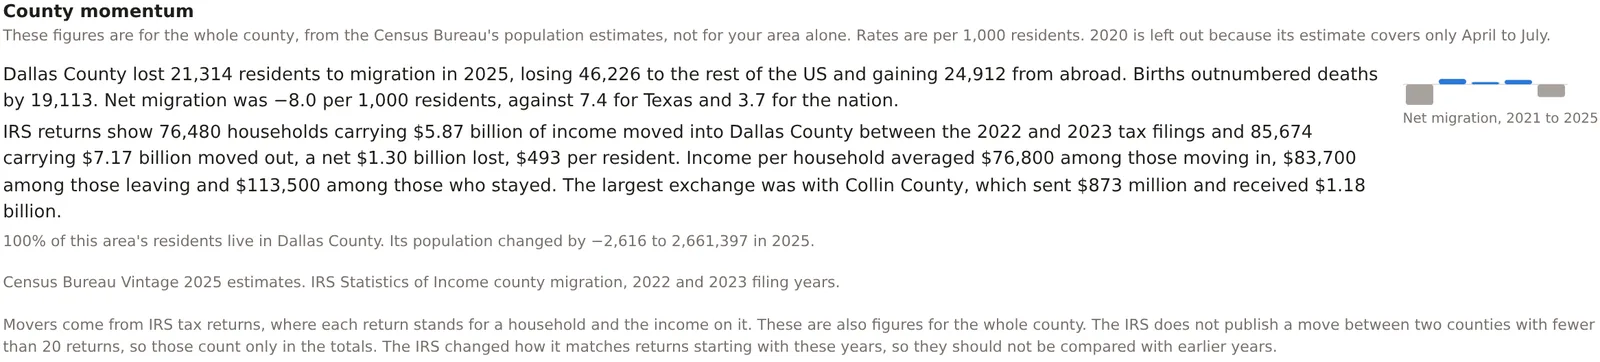
For each county holding at least a tenth of the area's residents, largest first and up to three, a line of text and a small chart. The text gives the county's net migration in the newest full year, split into moves from elsewhere in the United States and from abroad, births against deaths, and net migration per 1,000 residents beside the same rate for the state and the nation. The chart gives net migration by year from 2021 as columns from a zero line, a gain upward and a loss downward. Beneath, the share of the area's residents in the county and the county's population and its change.
The figures are for the whole county and never for the area itself, because the Bureau publishes the parts of population change for nothing smaller, and the section says so every time. The 2020 estimate covers April to July only, so it is never shown as a year.
On the Pro and Team plans each county also carries its movers from IRS tax returns. The IRS matches each year's returns to the year before by address, so a return filed from a different county counts as a household that moved, with its adjusted gross income. The line gives the households and income moving in and out, the net income per resident, the average income of households moving in, out and staying, and the county that exchanged the most income with this one. The IRS does not publish a flow between two counties under 20 returns, so those count only in the totals.
An example
The Downtown Dallas project on 30 October 2026 read a combined population of about 32,000 in 2016, 44,000 in 2021 and 45,000 in 2025, a rise of 40 percent, with the Klyde Warren circle up 34 percent and the Deep Ellum circle up 44 percent. County momentum said that Dallas County lost 21,314 residents to migration in 2025, losing 46,226 to the rest of the country and gaining 24,912 from abroad, with births outnumbering deaths by 19,113, a net migration of 8.0 per 1,000 residents lost against 7.4 gained for Texas and 3.7 for the nation. Its IRS line said 76,480 households carrying $5.87 billion moved in between the 2022 and 2023 filings and 85,674 carrying $7.17 billion moved out, a net loss of $493 per resident, with Collin County the largest exchange. A downtown growing by 40 percent inside a county losing people to its suburbs is exactly the pattern the two sections together are meant to show.
Things to know
The night figure for 2016 to 2021 includes visitors and the figure from 2020 on does not, so a hotel district reads a step down between the two series that is not a loss of residents.
A change over nine years in a small area is built on small numbers, and the newest years are estimates that the Bureau revises. Read the direction with more confidence than the last digit.
The IRS movers are households that file returns, so retirees and students who move without filing are not counted, and the IRS changed how it matches returns starting with these years, so the figures should not be compared with earlier releases.
Related pages
The Overview tab holds both sections. The map shows the same population surface by year. Growth momentum on the Economy tab turns the trend into an index against the nation, and the methodology page explains the two sources.