Growth momentum and home prices
Whether an area is growing faster or slower than the nation, on residents, jobs and real income per person, as an index against the nation at 100, with the growth of home prices shown beside it for context.
What this is for
A figure for today says what a market is. Growth momentum says which way it is moving, and how fast against the country as a whole. It combines three yearly growth rates, in the people who live in the area, the jobs located in it, and the real income of the people in its counties, each set against the nation's rate over the same years, so that an area adding residents, jobs and income faster than the nation reads above 100 and one losing them reads below. Home prices are shown beside it, because they are what most people mean by a market moving, and kept out of the index, because they follow interest rates and speculation as much as the area.
Where to find it
On the Economy tab, the eighth row of the summary table and the card headed Growth momentum, with Home prices, for context at its foot. Part of the Pro and Team plans.
How it is built
The index is the equal-weight geometric mean of three parts, each a yearly growth rate indexed against the nation's over the same years.
Residents come from the product's Census-based night population surface, which the Bureau's county and city estimates anchor year by year, read on the same cells the analysis uses, from 2021 to the newest estimate. Trend and history describes the surface.
Jobs are the LODES workplace counts on the same cells, from 2021 to the newest LODES year, which lags by about two years.
Real income per person is the Bureau of Economic Analysis's per capita personal income for the counties the area covers, weighted by the residents in each, over the PCE price index so that a dollar in each year buys the same thing, from 2021 to the newest BEA year. It is a county figure applied to the area, like the price level.
Every window starts in 2021, the first year of the residents surface, and ends at the newest year its source publishes, so the three windows differ in length and each rate is annualized. A growth rate can be negative, so each part is indexed as a growth factor, 100 times the area's yearly factor over the nation's. An area adding 2 percent a year beside a nation adding half a percent reads about 101.5, so the spread around 100 is a difference in yearly growth, and a reading of 103 is a fast-growing place.
The index needs residents and income and takes jobs when they are present. None of the three sources publishes a margin, so the index has no range.
Home prices are the yearly growth in the Federal Housing Finance Agency's annual house price index from 2021 to its newest year, with the nation's growth beside it and an index of the two, shown for context. Each block group takes its census tract's growth where FHFA publishes the tract in both years, else its ZIP codes', else its county's, and the card says what share of the area's owner-occupied homes was priced at each level.
Reading the results
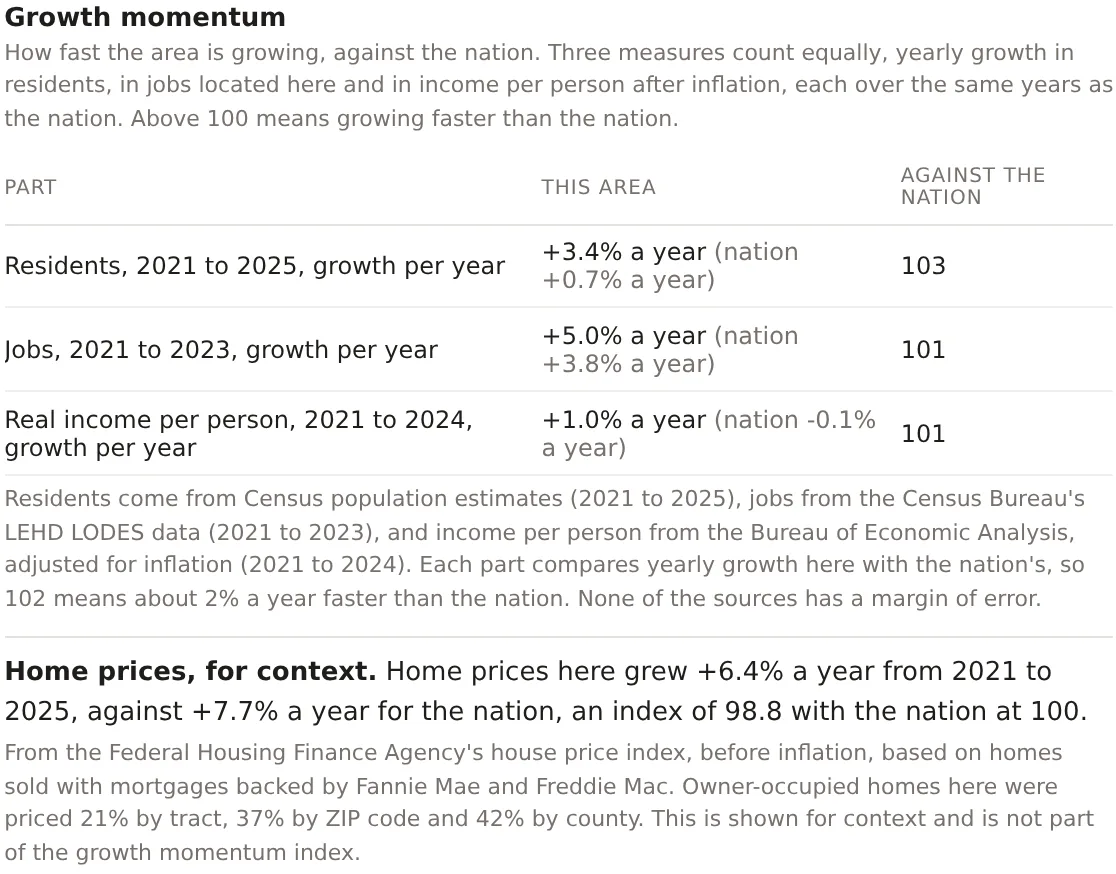
Each part is shown as the area's yearly growth, the nation's in brackets, and the index. The index itself is the combination. Because the spread is a difference in yearly growth, a few points above 100 is a lot. An area at 103 is growing about three percent a year faster than the nation on the combined measure, which over a ten year lease compounds to a third.
The home prices line reads the same way, with the area's yearly growth, the nation's, and an index at 100 for the nation. It is not in the index, and the card says so.
An example
The Downtown Dallas project on 30 October 2026 read 102, against 101 for both the metro and the county. Its residents grew 3.4 percent a year from 2021 to 2025 against 0.7 for the nation, an index of 103. Its jobs grew 5.0 percent a year from 2021 to 2023 against 3.8, an index of 101. Real income per person in Dallas County grew 1.0 percent a year from 2021 to 2024 against a national fall of 0.1, an index of 101. Home prices grew 6.4 percent a year from 2021 to 2025 against 7.7 for the nation, an index of 98.8, with 21 percent of the area's owner-occupied homes priced by tract, 37 percent by ZIP code and 42 percent by county. The reading is a downtown adding residents five times as fast as the nation and jobs a little faster, with home prices rising slightly slower than the national boom.
Things to know
The index is withheld below 500 residents at the start of the window. The jobs part is left out below 1,000 jobs and for an area touching Alaska or Michigan, whose LODES is carried forward from an older year, and the card says so. The income part is withheld where BEA publishes income for the counties of fewer than 99 percent of the area's residents.
Growth in residents is placed by city, not within it, so a newly built edge of a growing suburb can read low while its city reads right. Trend and history explains.
Home prices are nominal, before inflation, and built from the mortgages Fannie Mae and Freddie Mac bought or guaranteed, so jumbo loans and cash sales are not in them. FHFA leaves out a place with too few sales in a year, Manhattan has no series with both years, and where fewer than half of an area's homes are priced the figure is withheld.
Related pages
Job mix diversity comes before this card and Mortgage credit access after. Trend and history shows the residents series and the county migration behind the growth. The methodology page gives the windows, the sources and the county combination rules.