Mortgage credit access
How readily people in an area can get a mortgage to buy a home, for the area as a whole, from the home purchase applications lenders report, with the three parts, the two context shares and what the index never does.
What this is for
Whether the people of an area can borrow to buy a home says something about the area that income alone does not. It says how lenders judge the place, how its residents' credit stands, and whether home ownership is within reach. Mortgage credit access measures that from the applications lenders are required to report under the Home Mortgage Disclosure Act, for the area as a whole, against the nation at 100. A lender reads it as the market it would be entering, and a business reads it as a measure of how settled and creditworthy the area's households are.
Where to find it
On the Economy tab, the ninth row of the summary table and the card headed Mortgage credit access. Part of the Pro and Team plans.
How it is built
The index reads home purchase applications for a principal residence on a first lien, closed end, on one to four site-built units, pooled over the three newest years, which the card names. Three shares are each set against the nation's, and the index is their equal-weight geometric mean.
Home purchase applications denied, as a share of applications decided, inverted so that fewer denials reads higher.
Applications denied for credit history, as a share of decided applications, inverted the same way. This is the denial reason that speaks to the applicants rather than to the property or the loan.
Loans at a higher price, the share of loans above Regulation Z's higher-priced thresholds, 1.5 points over the average prime offer rate for a conforming loan and 2.5 above it for a larger one, inverted so that fewer such loans reads higher.
Each part is a share of good outcomes, so the spread around 100 is narrow, and the rates themselves are shown beside the parts with the nation's. Two more shares are shown for context and kept out of the index, namely the share of loans insured or guaranteed by FHA, VA or USDA, and the share of applications for manufactured homes.
A census tract's applications are given to an area in proportion to the share of the tract's 2020 residents the area holds. HMDA counts every application, so there is no sampling margin and the index has no range.
Reading the results
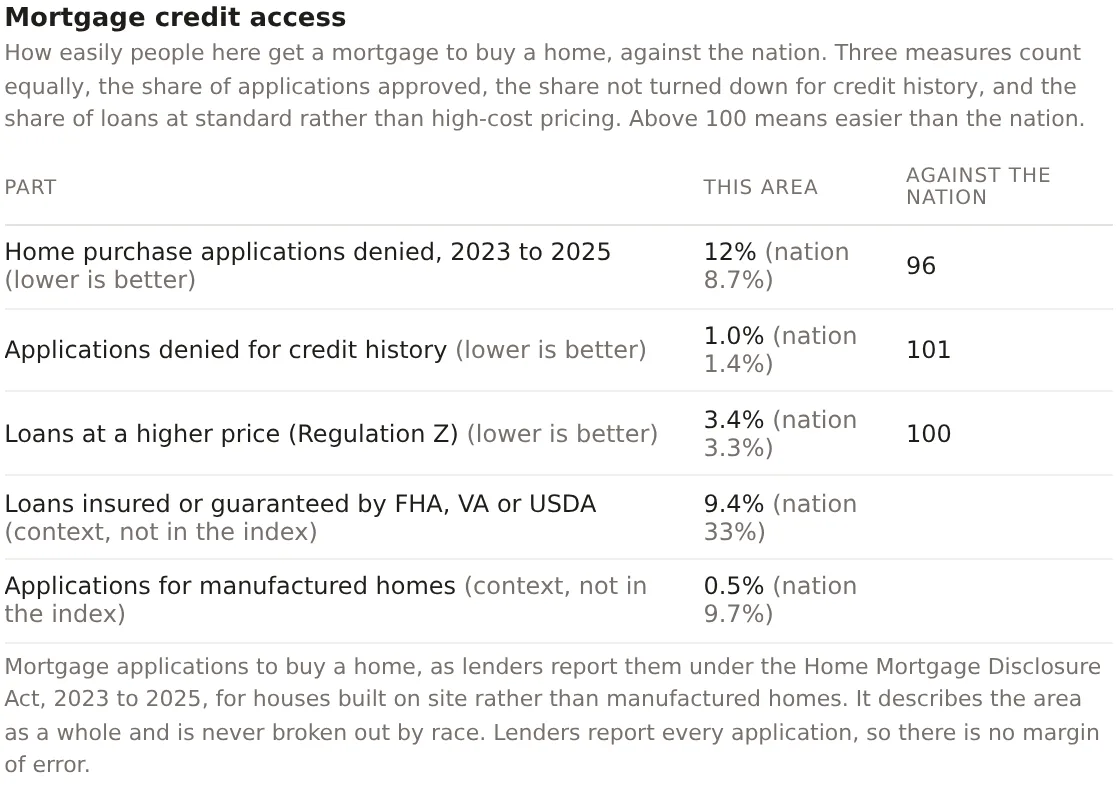
Above 100 means mortgages are easier to get here than nationally and below 100 harder. Because each part is a share of applications that went well, an area where a fifth of applications are denied reads in the low nineties rather than far below 100, and the rates beside the parts are where the size of the difference is read. Over 2023 to 2025 the nation denied 8.7 percent of such applications, 1.4 percent for credit history, and 3.3 percent of its loans were higher-priced. The Bronx denied 21.7 percent and Marin County 6.3, which read 94.6 and 101.9.
The context shares matter for reading the index. An area where most loans are FHA, VA or USDA is one where buyers lean on government programs, and an area where many applications are for manufactured homes is a different lending market, which is why manufactured homes are left out of every part. Nationally in 2025 they were denied at 55.9 percent against 8.7 for site-built homes, and half their loans were higher-priced.
An example
The Downtown Dallas project on 30 October 2026 read 99, against 100 for the metro and 98 for Dallas County. Over 2023 to 2025, 12 percent of its home purchase applications were denied against 8.7 nationally, an index of 96, 1.0 percent were denied for credit history against 1.4, an index of 101, and 3.4 percent of loans were higher-priced against 3.3, an index of 100. Loans insured or guaranteed by FHA, VA or USDA were 9.4 percent of its loans against 33 percent nationally, and applications for manufactured homes 0.5 percent against 9.7. The reading is a downtown whose buyers are turned down a little more often than the nation's, for reasons other than their credit history, and who rarely use government loan programs, which is what a condominium market of well paid buyers looks like.
Things to know
The index describes the area as a whole. It is never broken out by the applicants' race, ethnicity or sex, and those fields in the HMDA data are not read.
The index is withheld below 100 decided applications, so a small or mostly rented area reads nothing.
Small lenders may leave out denial reasons and rate spreads, so each rate is measured over the records that report them.
Related pages
Growth momentum comes before this card and Tract designations after. Affordability asks whether the area's households can afford its homes, which is the other half of the question. The methodology page gives the thresholds and the national rates.