The stress test
Whether the ranking of a project's sites survives a change in the trade area or the thresholds, with the geographies, the threshold variants, the tie-break measure, the rank matrix, the flips and level pairs, and the two folded tables.
What this is for
A site ranking depends on assumptions nobody states. The trade area was a one mile circle because that is what was drawn. The income threshold was $50,000 because the sheet said so. Change the circle to a ten minute drive or the threshold to $45,000 and the order of the sites may change, and a decision that rests on an order that fragile should know it. The stress test measures every site under every scenario you choose and reports whether the leader holds, which pairs swap, and which figures moved them, so that the stability of a ranking is a fact on the page rather than a hope.
Where to find it
The card headed Stress test at the top of the Compare tab on the analysis page. It is part of the Pro and Team plans. When a criteria sheet is attached to the project the test judges each scenario against it, and without one it ranks on the tie-break measure alone.
Step by step
- Under Geographies, choose the scenarios. Saved shape uses each site's area as saved. The 1, 2, 3 and 5 mi ring choices redraw every site as a circle of that radius from its center, and the 5, 10, 15 and 20-min drive choices as a drive time from it.
- Under Thresholds, with a sheet attached, choose as written, tightened 20% and loosened 20%, any or all. Tightened moves every threshold a fifth in the direction that makes it harder to pass.
- Choose the tie-break measure, which orders sites that pass the same number of lines, from residents, daytime population, households, median household income and jobs.
- Press Run the stress test. Each site is measured once for each geography, which takes longer for drive times, and the results appear as they finish. The status line says how many sites are measured under every scenario.
- Read the sentences, the matrix and the two folded tables. Download CSV saves every site under every scenario, and Measure again repeats the measurements after a site changes.
How a scenario ranks the sites
Within a scenario the sites are ordered by the lines of the sheet they pass, then by the measures they lead on, then by the tie-break measure. Nothing is weighted, so every rank can be traced to the figures beside it. Without a sheet the order is by the tie-break measure alone.
A change of leader between two neighboring scenarios is a flip and is named with the figures that moved. When the deciding figures sit within each other's margin of error or within five percent, the pair is called level rather than a change, because the order between two sites that close is not a finding.
Reading the results
The sentences at the top say in words how often each site leads, which scenarios flip it, and whether any site meets every line of the sheet. They are the summary a report quotes, and the PDF prints them.
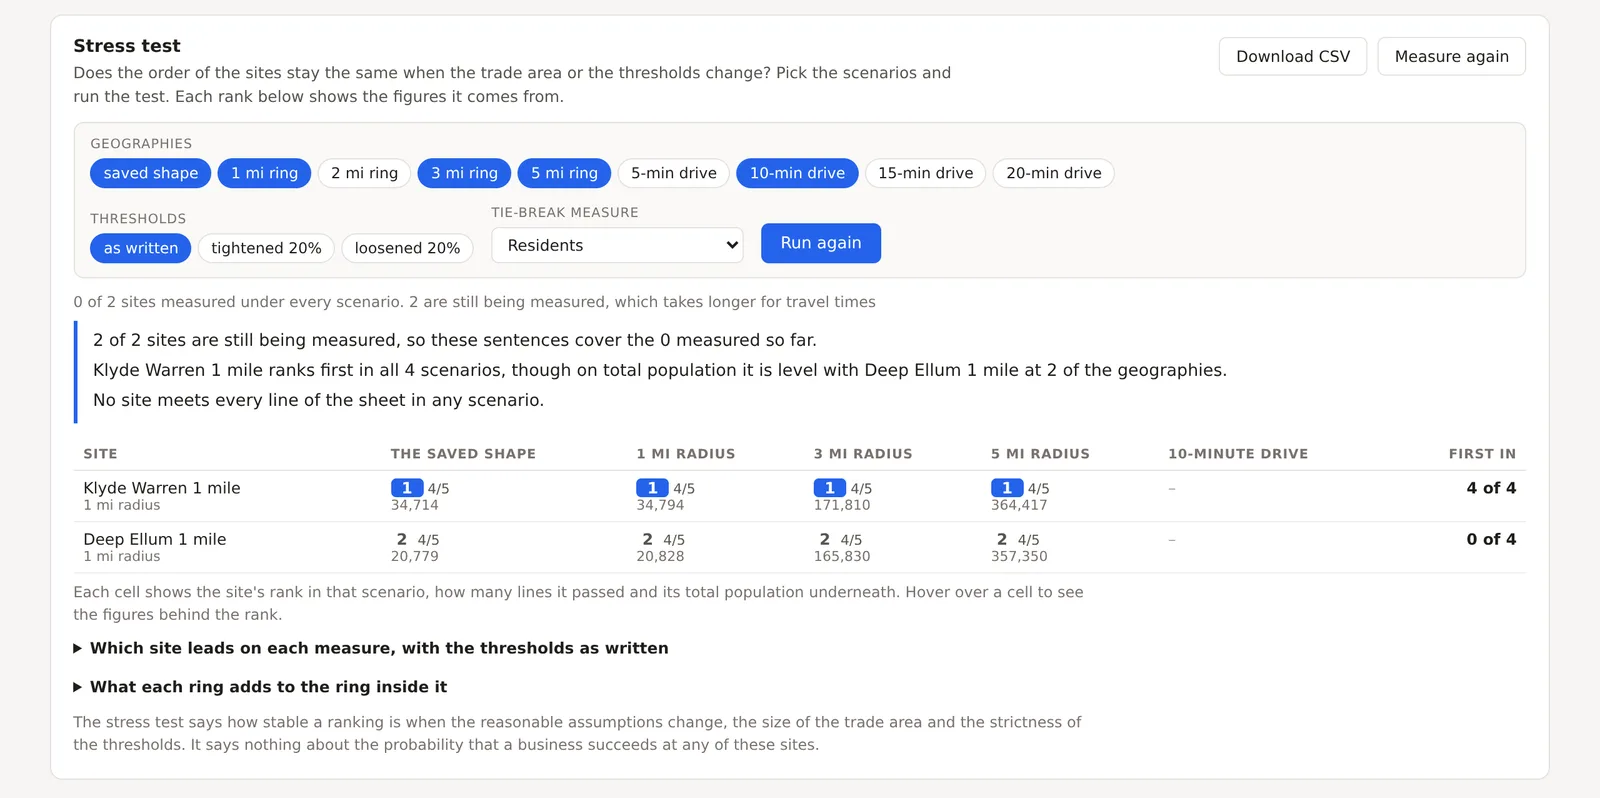
The matrix has a row per site and a column per geography, and each cell gives the site's rank in that scenario, how many lines it passed, and its total population beneath. The last column counts how many scenarios the site led. Hover a cell for the figures behind the rank.
Which site leads on each measure, with the thresholds as written folds open to a table of the measures with the leading site in each, so that a site which ranks second overall can be seen to lead on income.
What each ring adds to the ring inside it folds open to the ladder of totals between nested rings, which is a subtraction of sums between radii only. A drive time and a circle are not nested, so they are shown side by side and never differenced, and medians are not shown here because a median cannot be subtracted.
An example
The Downtown Dallas project on 30 October 2026, with the coffee template attached, was tested on the saved shape and the 1, 3 and 5 mile rings with residents as the tie-break. The Klyde Warren circle ranked first in all four scenarios, passing four of five lines in each, with 34,714 residents on the saved shape, 34,794 on the one mile ring, 171,810 at three miles and 364,417 at five, and the Deep Ellum circle ranked second in all four with 20,779, 20,828, 165,830 and 357,350. The sentence noted that on total population the two are level at two of the geographies, because at three and five miles the circles cover almost the same ground and differ by under five percent. No site met every line. The order holds, and the test says exactly where it is close.
Things to know
The test says how stable a ranking is under the assumptions chosen. It says nothing about the probability that a business succeeds at any site, and the card says so.
Across a large estate measured for a published study, a ten minute drive reached a median 1.72 times the residents of the three mile ring in 1.79 times the area, so the two shapes usually disagree, which is why both are offered.
Drive time scenarios need the routing service and take longer. The matrix fills in as each finishes.
Related pages
The site criteria screener supplies the sheet the test judges against. Decision history keeps the test's sentences with the record of a decision. Rings and bands and Travel time areas describe the geographies, and the methodology page gives the ranking rule.