Economic development and planning
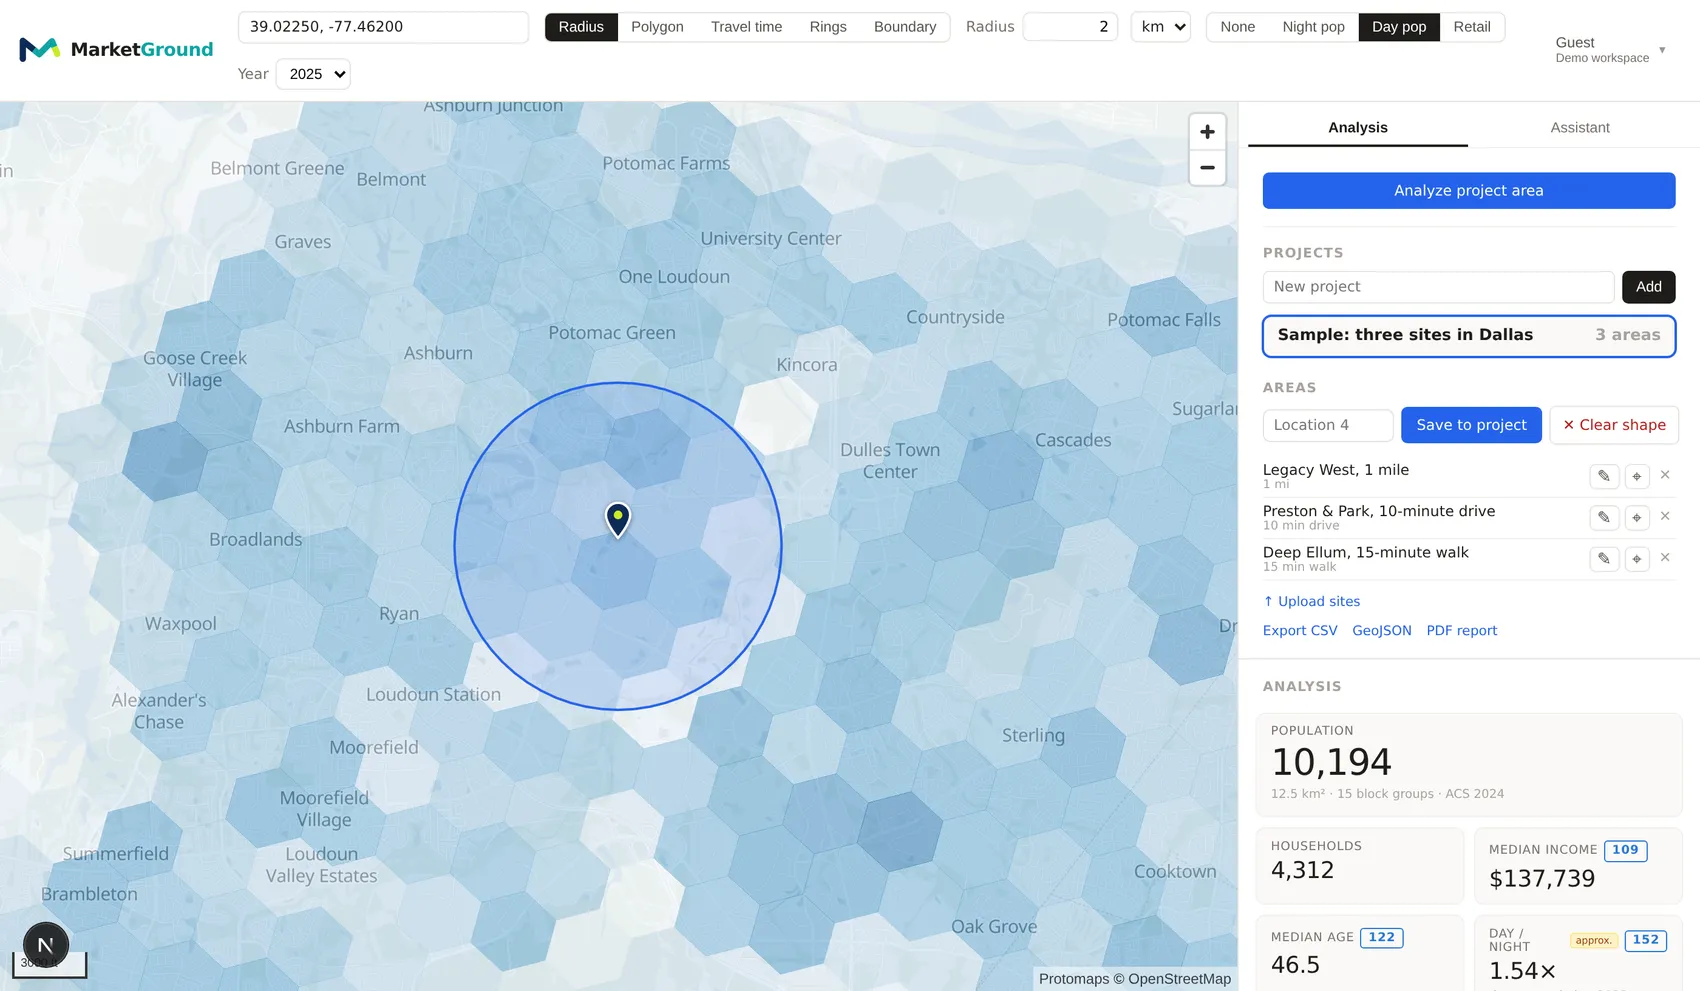
Analyze the people and jobs within a district
Use public data to describe the population, employment and businesses within a corridor or area of interest. MarketGround calculates results for the boundary you choose and includes source information for reports and presentations.
A worked example
Compare employment centers in Northern Virginia
Using the same two-kilometer radius, the study estimates 110,559 people during the working day around Tysons Corner and 15,685 around the data center corridor in Ashburn. The corresponding job counts are 105,500 and 10,864. Listed businesses also differ, with 5,435 at Tysons and 741 in the Ashburn area. These measures describe different patterns of local employment and business activity.
The full study, with maps and the datasetCounty context in one click
Whole counties, analyzed as themselves.
| County | Residents | Households | Daytime population | Jobs | Median income |
|---|---|---|---|---|---|
| Loudoun County, Virginia | 432,998 | 143,032 | 419,375 | 197,530 | $182,385 |
| Fairfax County, Virginia | 1,147,837 | 414,101 | 1,273,773 | 684,318 | $153,860 |
Swipe the table sideways to see every column.
Population, household and employment measures for the selected county boundaries. Source details are on the methodology page.
Loudoun's daytime estimate is 419,375, compared with 432,998 residents. Fairfax's daytime estimate is 1,273,773, compared with 1,147,837 residents. The county view provides context for the smaller areas in the study.
What it answers
Examine an area from several perspectives
Review residents, daytime population and jobs by industry within the proposed boundary. Explore household characteristics and compare the results with the county or metro area. Travel areas add another view of access by car, on foot, by bicycle or by public transit.
Questions
Questions people ask
Why would a council or a development group use this?
MarketGround brings public population, employment and business data together for a selected area. It can help describe existing conditions and compare a corridor or district with the wider region.
Can I measure a proposed district rather than an existing boundary?
Yes. Draw or upload the proposed boundary and analyze it as an area. You can also select a ZIP area, city, county, metro area or census tract.
Is the data defensible in a public meeting?
The report identifies its public data sources and includes methodological notes. The methodology page explains the calculations and validation checks used to produce the figures.
Does it show jobs by industry?
Yes. MarketGround groups jobs by workplace industry and provides employment history for the selected area.
Can we publish the figures?
Yes. You can use the results in reports and presentations under the terms of service. Preserve any required source attribution. Contact us if you would like to discuss a particular analysis.
Other trades
Explore other industries
Explore other industry examples or visit the research section for studies and practical guides.
Add local population, employment and travel access information to commercial property analysis.
Compare candidate stores with existing locations using consistent demographic and business measures.
Evaluate proposed territories and examine their overlap with existing franchise locations.
Explore a district in your community
Draw the area and review its population, jobs and listed businesses. Use the results to support a discussion of current conditions.