Rideshare, delivery and field operations
Add local population context to your service areas
Compare resident and daytime population estimates within the zones you operate. MarketGround also shows local jobs and businesses to support decisions about coverage, service areas and depot locations.
The problem
Compare residential and employment areas
Airports, hospitals and business districts can have substantial activity alongside small resident populations. Reviewing residents, daytime estimates and jobs together helps describe these areas. The Dallas examples show how those measures vary across six zones.
Measured
Six zones in one metro.
| Zone | Residents | Daytime population | Day against night | Jobs |
|---|---|---|---|---|
| Dallas Fort Worth airport, 3 km | 23 | 40,505 | 1,731× | 41,653 |
| Downtown Dallas, 1 km | 10,554 | 122,620 | 11.6× | 105,396 |
| Legacy West, Plano, 1 mile | 7,890 | 79,959 | 10.1× | 75,820 |
| Deep Ellum and Baylor, 1 mile | 20,142 | 142,127 | 7.1× | 120,858 |
| Arlington stadium district, 2 km | 14,655 | 40,810 | 2.8× | 28,835 |
| Firewheel, Garland, 3 miles | 99,528 | 70,558 | 0.71× | 16,432 |
Swipe the table sideways to see every column.
The table compares residents, estimated daytime population and jobs for each selected area. Source details are on the methodology page.
The airport area has 23 residents and an estimated daytime population of about 40,505. Firewheel has about 100,000 residents and a daytime estimate of about 70,558. The contrast adds context when comparing the areas you serve.
What you can do with it
Compare zones and potential hubs
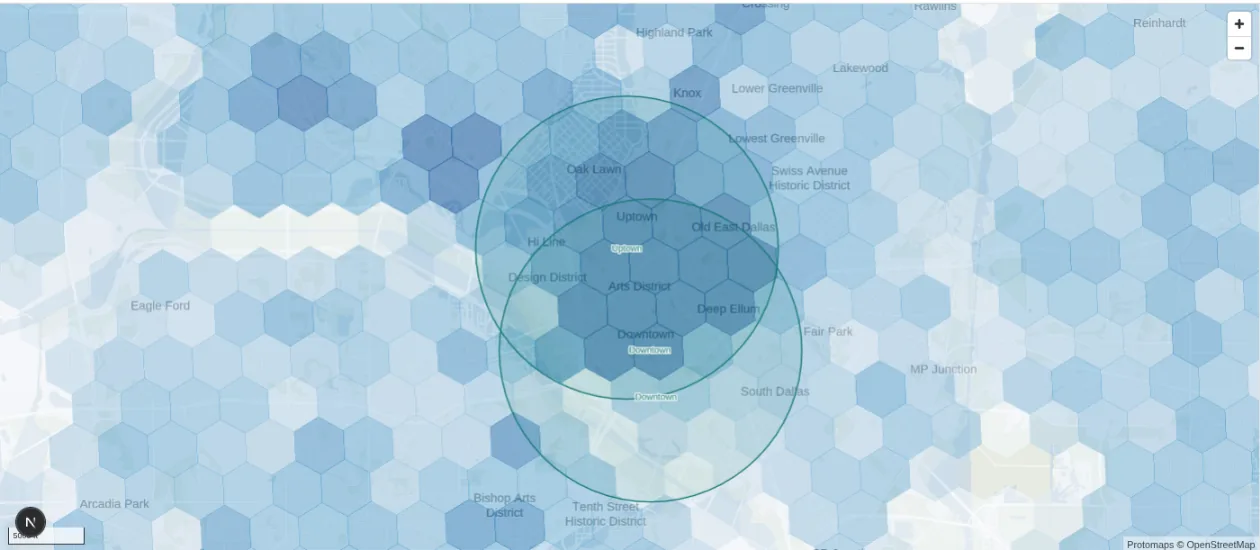
Draw each zone and review its residents, daytime estimate and jobs. For a depot or hub, compare the households and businesses within a chosen driving time from each candidate. Use local demographics alongside your operating data when reviewing service coverage.
Questions
Questions people ask
Does MarketGround show demand by hour?
No, and it says so plainly. It carries two populations, the residents who sleep in an area and the people present during the working day, plus the jobs inside it by industry. That is enough to tell a morning market from an evening one and a weekday district from a weekend one, but it is not an hourly demand curve and nothing here pretends to be one.
How would I use it for zone design?
Draw a polygon, radius or travel area for each proposed zone. Compare residents, daytime population, jobs and businesses, then combine those measures with your trip patterns and operating requirements.
Can it help site a depot or a hub?
Yes. Draw a travel area from each candidate and compare the households and businesses within reach. This helps you examine how road access affects coverage.
What about airports and stadiums?
You can analyze them using the same geographic tools. For example, the three-kilometer area around Dallas Fort Worth airport has 23 residents, an estimated daytime population of 40,505 and 41,653 jobs.
Is the driver supply side covered?
Partly. Where drivers and couriers live is a resident question, so the demographics answer it, including income, vehicle commuting and the share of people who work from home. Where they are at any given hour is not something public data reports.
Other trades
Explore other industries
Explore other industry examples or visit the research section for studies and practical guides.
Add local population, employment and travel access information to commercial property analysis.
Compare candidate stores with existing locations using consistent demographic and business measures.
Evaluate proposed territories and examine their overlap with existing franchise locations.
Review a zone you already serve
Compare its residents, daytime estimate and jobs with the demand patterns in your own operating data.